Idea Analysis Graph – Market Analysis Visualization
RJ0300045_31
- Last Update 04/30/2025
- File Size 0.4MB
- # of Slides 2
- File Format PPTX
- Slide Ratio 16:9
- Color
Keywords
About the Product
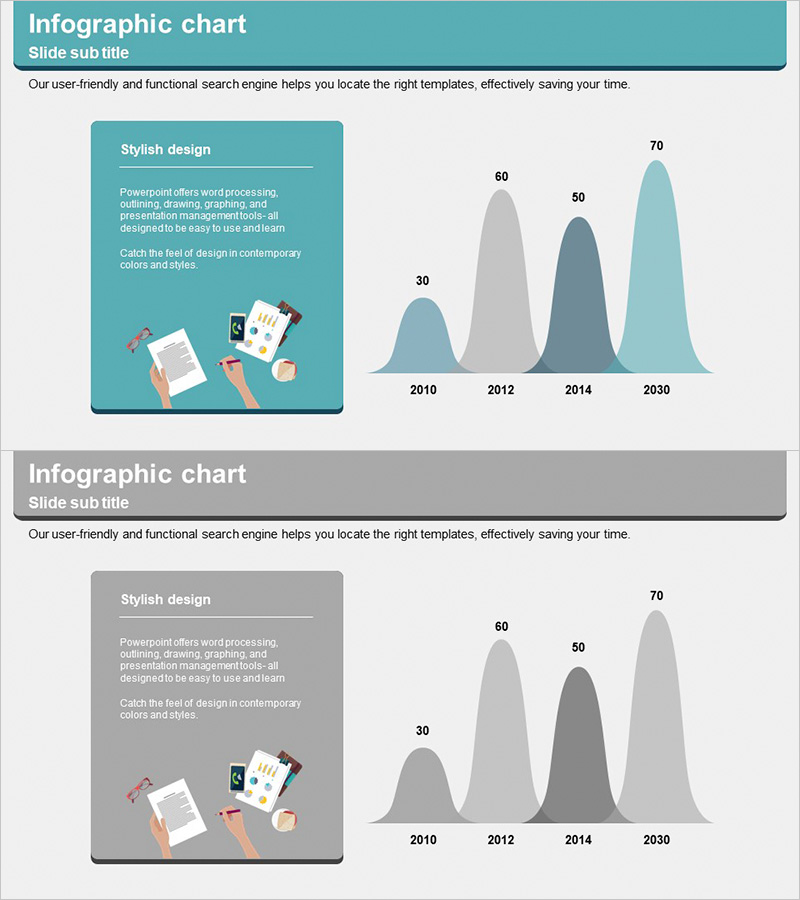
A multi-line curve graph PowerPoint slide designed for market analysis and competitive comparison. The 2-slide set uses teal and gray tones to enhance data visualization clarity. The left text box accommodates analysis content, while the right chart area displays four curves representing trends from 2010 to 2030. Each curve can represent different market indicators, competitor performance, or strategic metrics. Instantly applicable to presentation decks and business plan market analysis sections.
Usage Points
-
Main Usage
Compares multiple data sets over time to analyze market conditions, competitor performance, and idea evaluation. The four curves enable simultaneous visualization of different metrics or competitor trajectories, providing data-driven decision-making support.
-
How to Use
Enter analysis topic and description in the left 'Stylish Design' box, then input actual data into the right chart. Connect each curve color (teal, gray, dark blue, light teal) to a legend to clarify comparison items. During presentation, explain trend changes year by year.
-
Recommended For
Recommended for executives, planners, and analysts presenting market analysis sections in marketing plans, business proposals, and investor pitch decks. Ideal for competitive benchmarking, market share evolution, customer satisfaction trends, and multi-metric comparisons.
-
Slide Structure
2-slide set with teal header and left text box (title and description input area) paired with right 4-curve chart on the first slide. Second slide provides gray-tone variant for document tone adjustment. Both slides are optimized for 16:9 widescreen format, compatible with modern projectors and online presentations.
Related Products
-

Analysis of the Causes of the Rise and Fall in Sales Slide
#Operational Plan #Market and Competitor Analysis #Graph
-

Analysis Graph of Key Performance and Corporate Growth Indicators – Emphasizing Business Achievements
#Business Strategy #Market and Competitor Analysis #Graph
-

Market and Share Analysis Slide - Blue Green Design
#Market and Competitor Analysis #Graph #Other
-

Mobile Application Analysis Graph – Data Visualization for Market Understanding
#Market and Competitor Analysis #Graph #Other
