US Construction Market Analysis Slide - Business Strategy
RJ0300034_14
- Last Update 04/27/2025
- File Size 4.5MB
- # of Slides 2
- File Format PPTX
- Slide Ratio 16:9
- Color
Keywords
About the Product
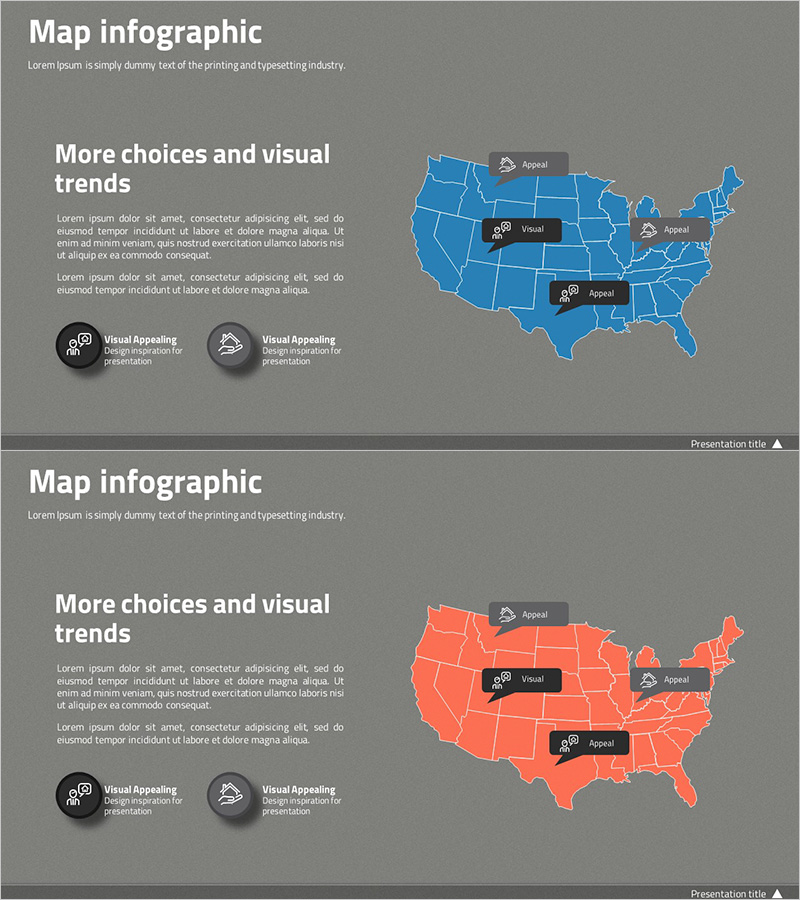
A state-by-state US map infographic PowerPoint slide available in two color versions: blue and red. This slide enables regional data comparison, market analysis, and business strategy development across all 50 states. Callout elements are positioned on key regions to highlight specific data points, statistics, or strategic insights. The layout provides ample text input areas for marketing strategies, competitive analysis, research reports, and business presentations. Delivered in 16:9 widescreen format with 2 slides, ready for seamless integration into your presentation flow.
Usage Points
-
Main Usage
Essential for analyzing the US market by region and developing targeted strategies. The state-level map provides instant visual clarity on regional market conditions, business opportunities, and competitive positioning. Callouts enable you to highlight critical data, market insights, or regional performance metrics.
-
How to Use
Input text, numerical data, and icons into each state region to display location-specific information. The blue version conveys trust and positive momentum; the red version emphasizes growth, alerts, or critical focus areas. Add key statistics or strategic priorities to the callout bubbles to maximize presentation impact.
-
Recommended For
Ideal for marketing strategy presentations, market research reports, regional business planning, competitive analysis, investor pitches, and sector-specific presentations in construction, real estate, retail, manufacturing, and distribution. Best suited for executives, managers, marketing teams, and sales professionals.
-
Slide Structure
Two-slide set featuring blue-toned and red-toned US state maps. Each slide includes a title area, full US map with state boundaries, and 3–4 strategically positioned callout bubbles for layered regional information display.
Related Products
-

Target Area Analysis - Effective Data Visualization
#Company Introduction #Other #Domestic Network
-

Infographic Slide Visualizing Exercise Practice Area Location
#Company Introduction #Marketing Plan and Strategy #Other
-

Analyzing the Map of America – Key Values and Market Status
#Company Introduction #Other #Domestic Network
-

Infrastructure and Regional Marketing Strategies – Data Visualization Template
#Company Introduction #Business Introduction #Graph
