Product/Service
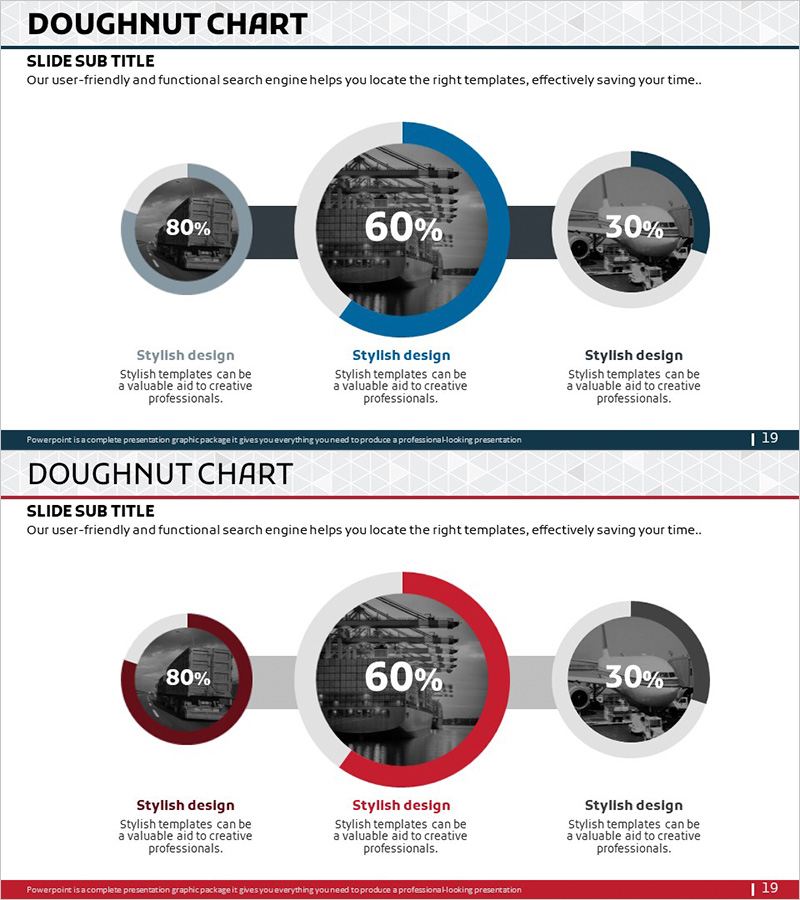
Graph of Transportation Service Usage Status – Market and Competitor Analysis
RJ0300030_19
- Last Update 12/21/2025
- File Size 8.1MB
- # of Slides 2
- File Format PPTX
- Slide Ratio 16:9
- Color
Keywords
About the Product
This slide effectively presents the usage status of transportation services using a doughnut chart. The graph clearly visualizes each data element, with a harmonious mixture of blue and red colors that enhances its visual impact. This template is particularly useful for materials that involve market share and competitor analysis. It's ideal for presentations that emphasize service usage rates to stakeholders. The composition of text and images is easy to modify, and the editing difficulty is rated as 'easy'.
Related Products
-
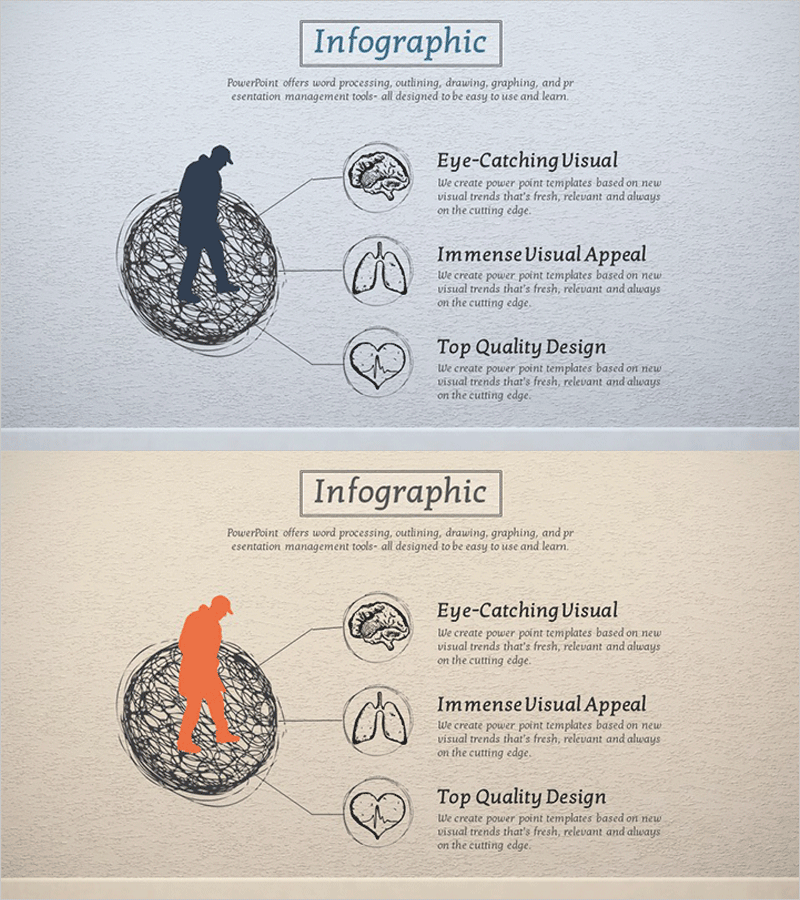
Aging Causes Characteristics Diagram – Business Presentation
#Company Introduction #Product/Service #Diagram
-

Illustration Cutlery Diagram - Product Introduction and Design Aesthetic
#Product/Service #Diagram #Product/Service Introduction
-
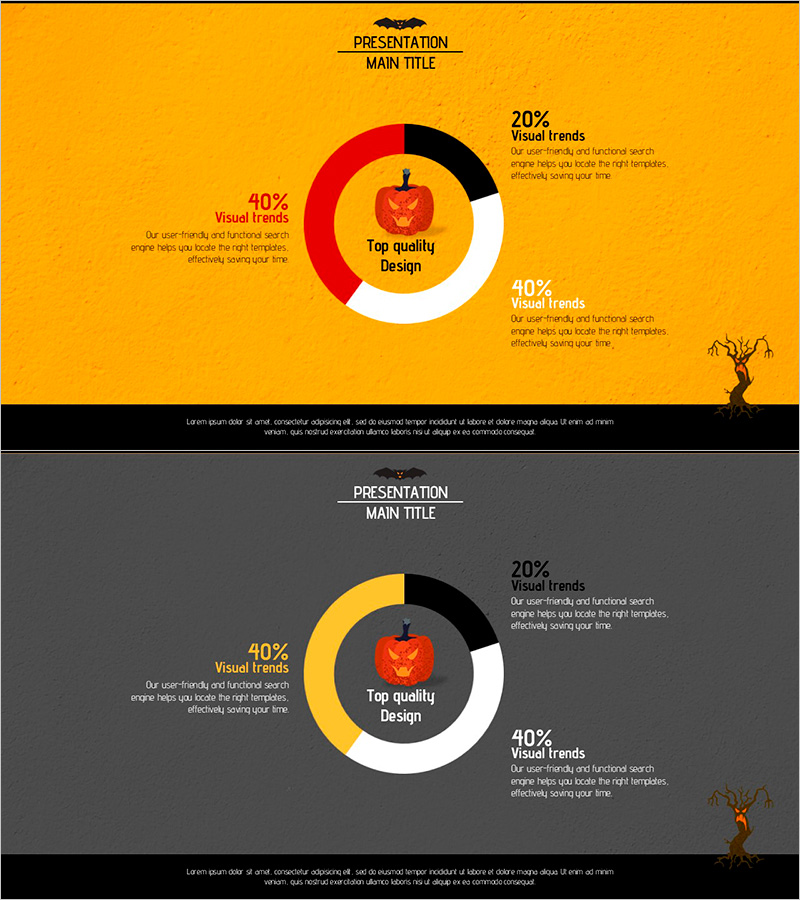
Halloween Share Chart – Market Analysis and Visual Communication
#Market and Competitor Analysis #Graph #Market Share
-
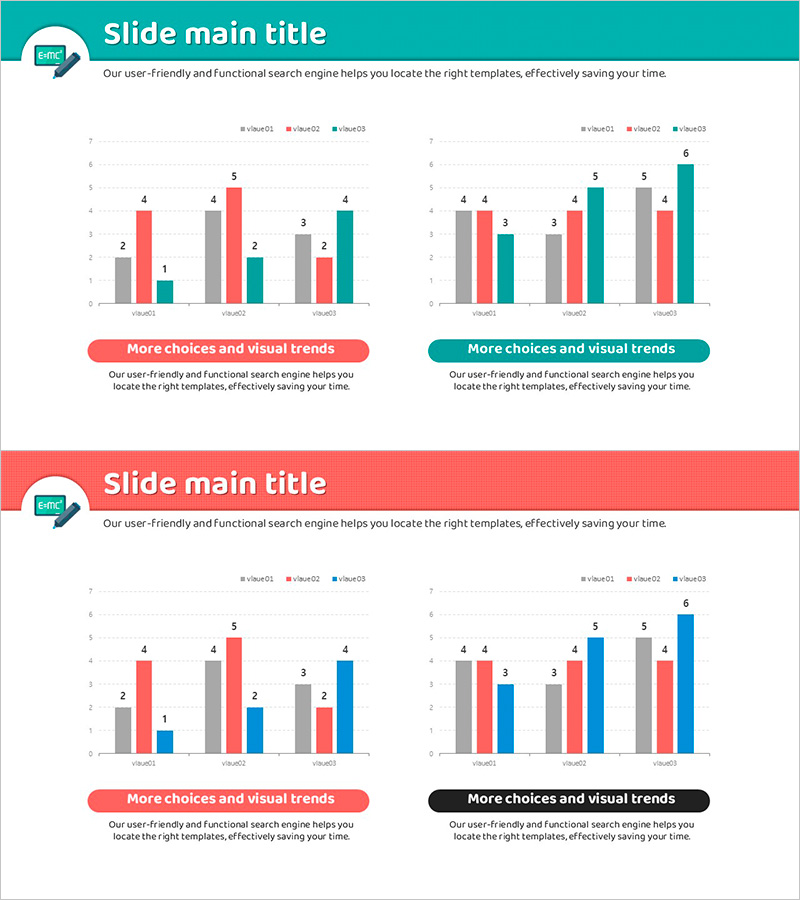
Competitor Analysis Vertical Comparison Graph – Insights and Performance
#Market and Competitor Analysis #Graph #Competitor Analysis
