Market and Competitor Analysis
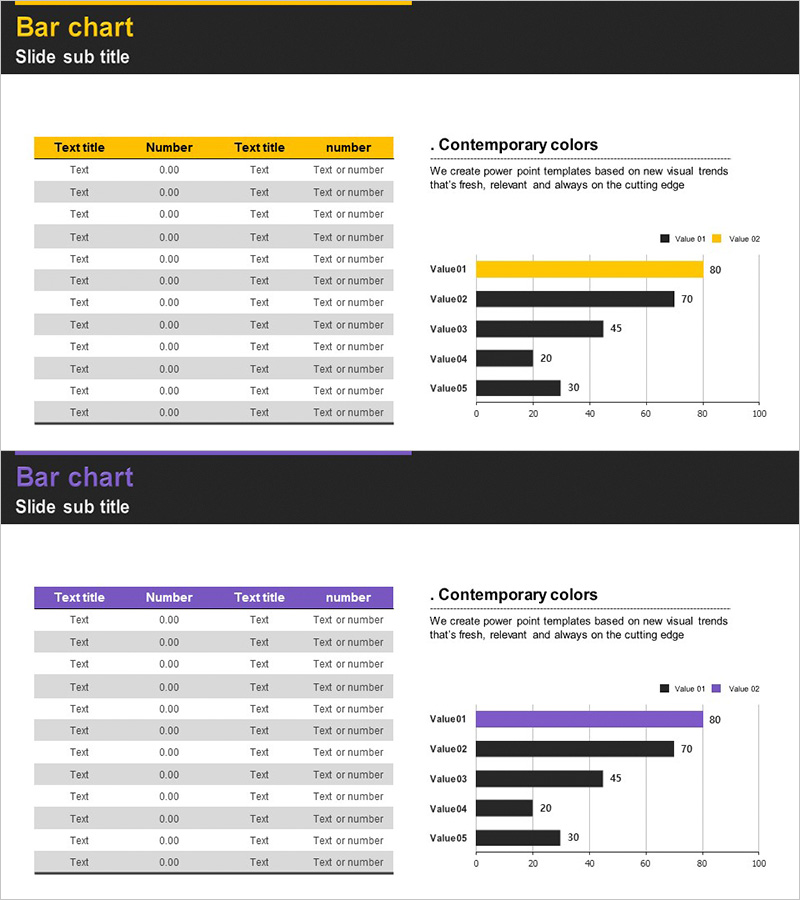
Sales and Profit Analysis Tables & Graphs – Data-Driven Insights
RJ0300013_9
- Last Update 12/21/2025
- File Size 0.1MB
- # of Slides 2
- File Format PPTX
- Slide Ratio 16:9
- Color
Keywords
- #Content-Based Slides
- #Design-Based Slides
- #Market and Competitor Analysis
- #Financial Plans and Performance
- #Diagram
- #Graph
- #Competitive Advantage
- #Sales and Revenue
- #Table
- #Horizontal Bar
- #Horizontal Table
- #Horizontal Bar Chart
- #16:9
- #Sales Analysis
- #Financial Planning
- #Market Analysis
- #Table
- #Horizontal Bar Chart
About the Product
This slide features a combination of horizontal bar graphs and tables designed to effectively visualize sales and profit analysis. The upper section consists of two input tables for text and numbers, while the right side displays a data visualization graph for comparing two values. The modern color scheme of yellow and purple enhances visibility and readability. It is suitable for communicating competitive analysis and financial planning in various corporate presentations. The slide offers an 'easy' editing difficulty, allowing users to easily replace text and graphs according to their needs.
Related Products
-
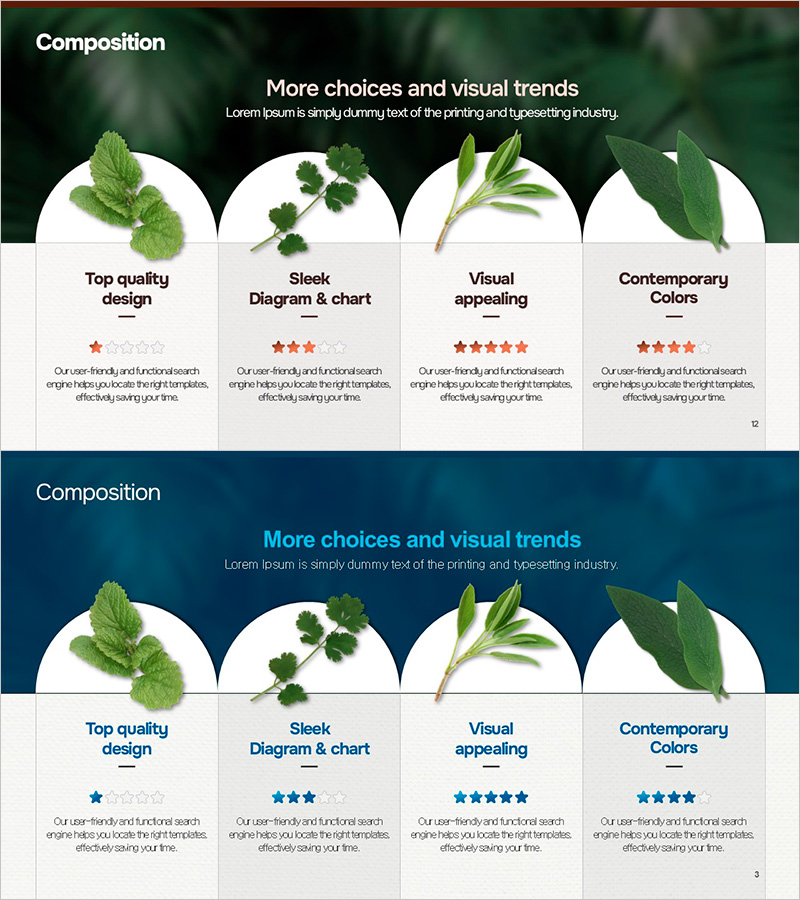
Strengths and Star Ratings of Natural Materials – Customer Success Stories
#Market and Competitor Analysis #Customer Success Stories #Diagram
-
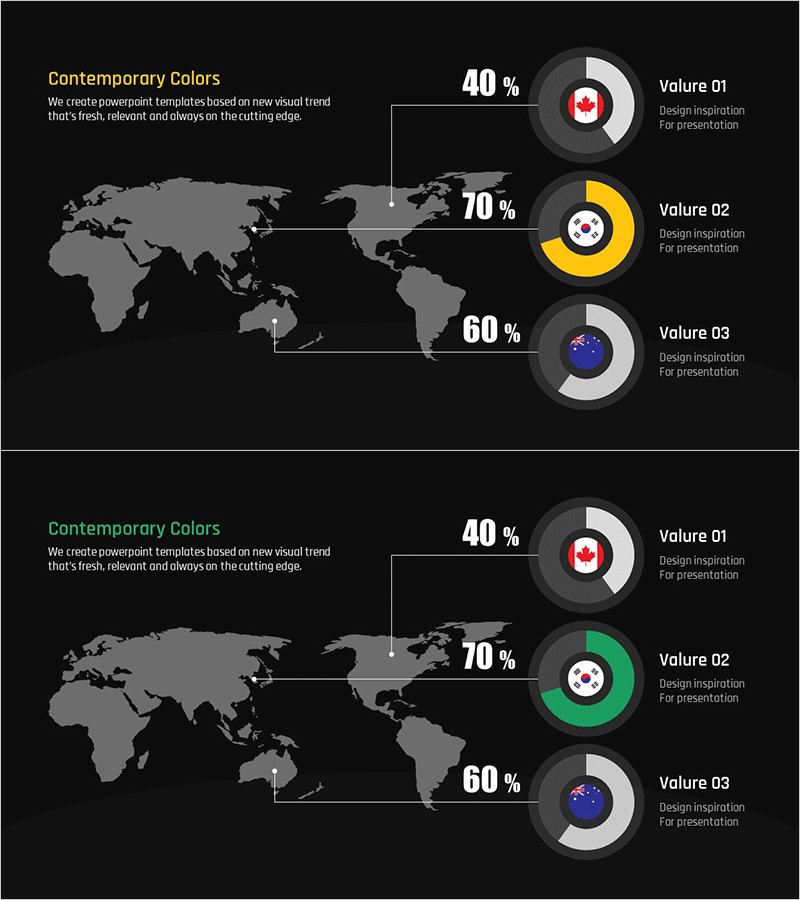
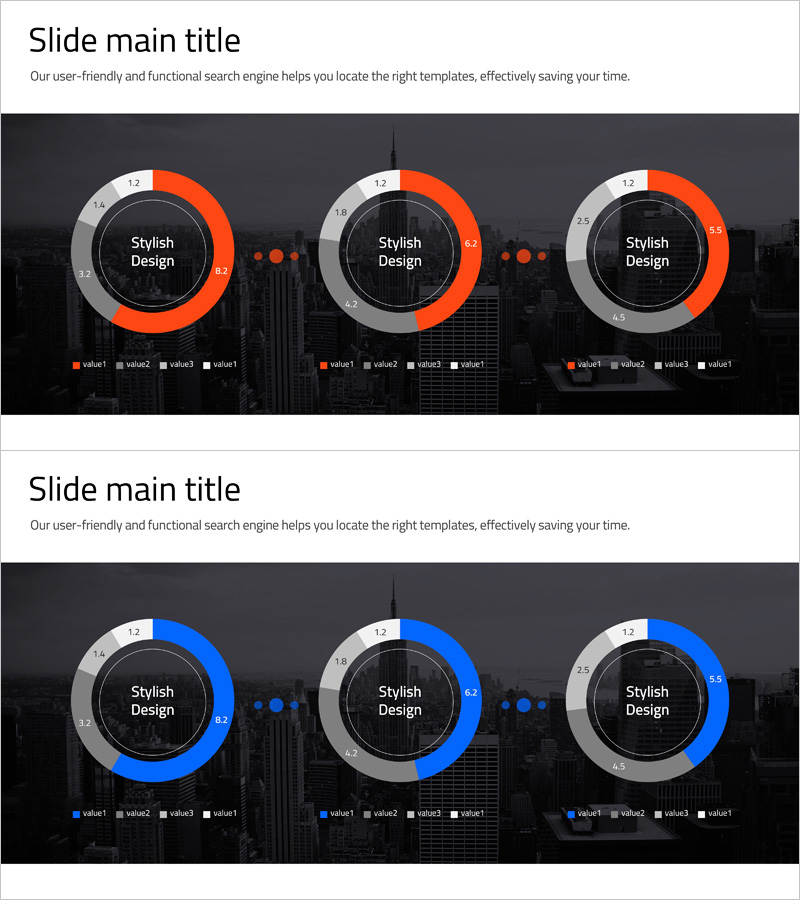
Donut Chart Slide Visualizing Target Market Development Status
#Market and Competitor Analysis #Graph #Other
-
Business Market Analysis Donut Circle Chart – Visualizing Competitive Advantage
#Market and Competitor Analysis #Graph #Competitor Analysis
-

Setting Business Marketing Goals – Effective Marketing Strategy
#Business Vision and Strategy #Marketing Plan and Strategy #Diagram
