Product/Service
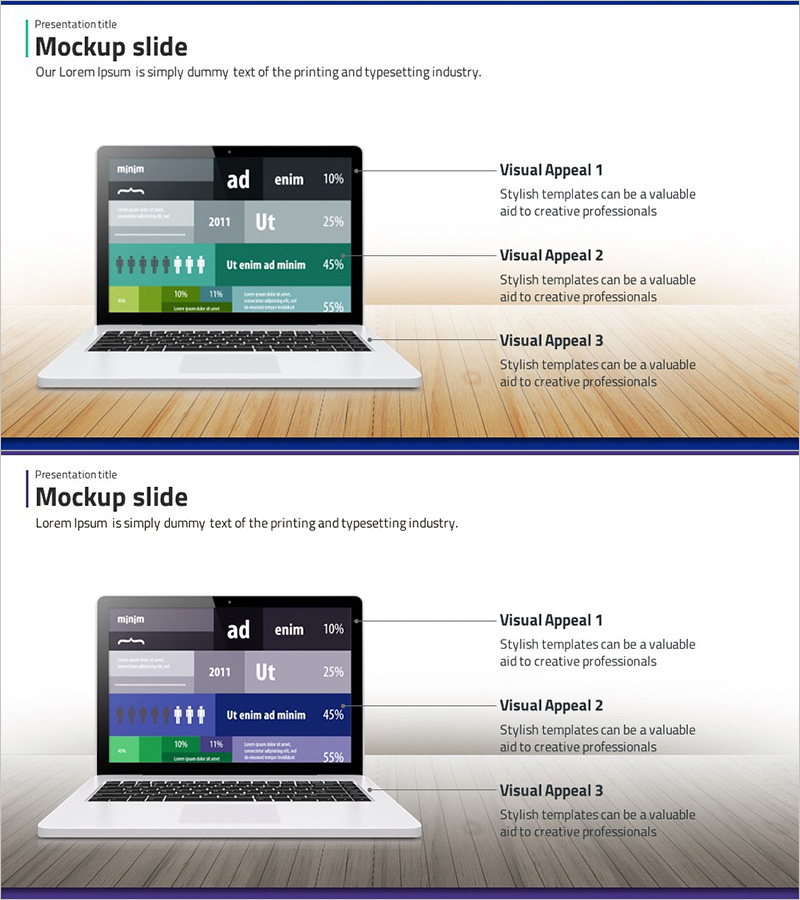
Development Status Analysis Notebook Diagram – Effective Data Visualization
RJ0300010_12
- Last Update 12/21/2025
- File Size 4.1MB
- # of Slides 2
- File Format PPTX
- Slide Ratio 16:9
- Color
Keywords
About the Product
This slide utilizes a notebook diagram for analyzing development status, clearly illustrating the flow of information. With an intuitive design and data structure, it aids stakeholders and management in easily understanding the progress of projects. The blue and green color combination conveys trust and vibrancy, while the spreading diagram format demonstrates how information evolves. It is highly useful for presentations and report writing, with a moderate editing difficulty for quick usage.
Related Products
-
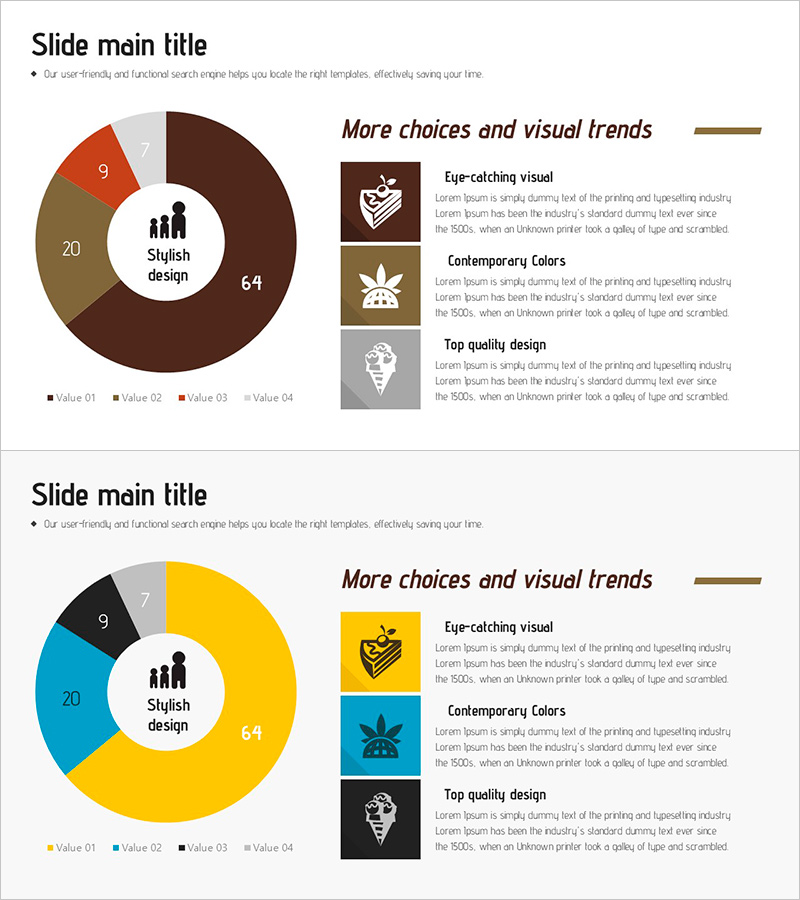
Donut Chart Slide for Dessert Menu Research – Market Analysis
#Market and Competitor Analysis #Diagram #Graph
-
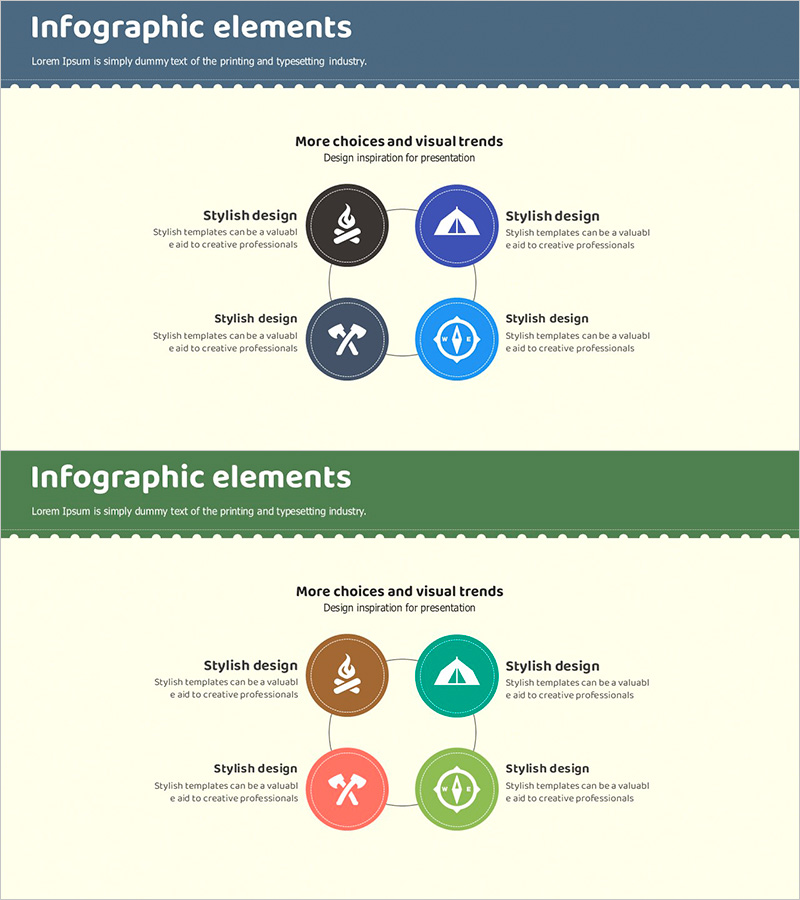
Service Configuration Diagram Camping Icon
#Business Introduction #Technology Sector #Diagram
-
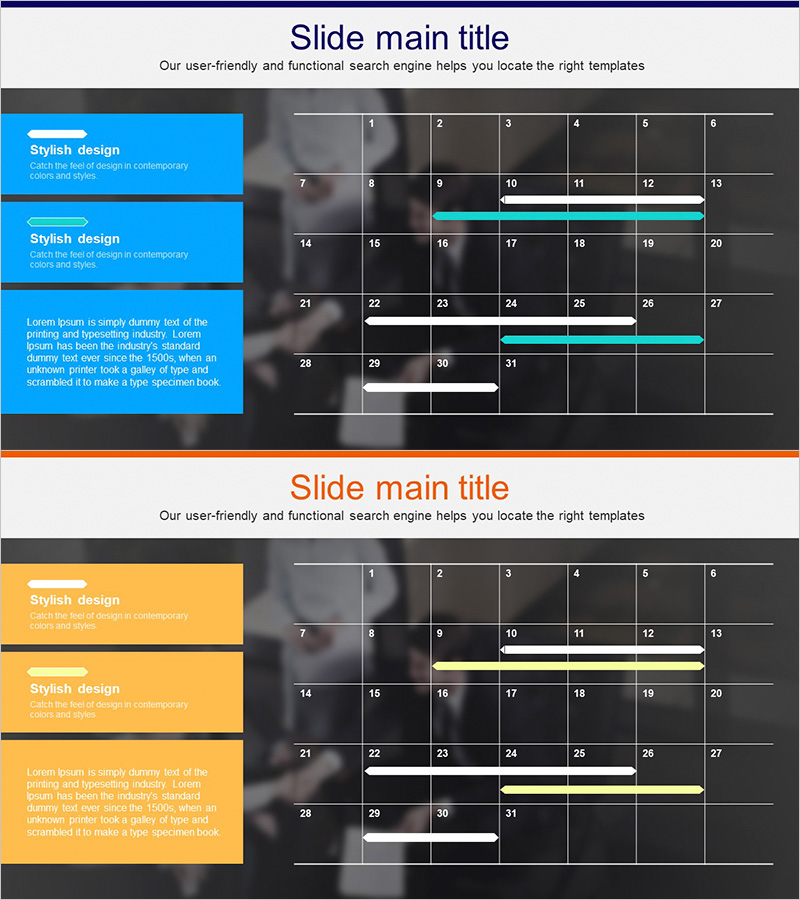
Work Progress Schedule – Systematic and Stylish Diagram
#Business Promotion Strategy #Operation Plan #Diagram
-
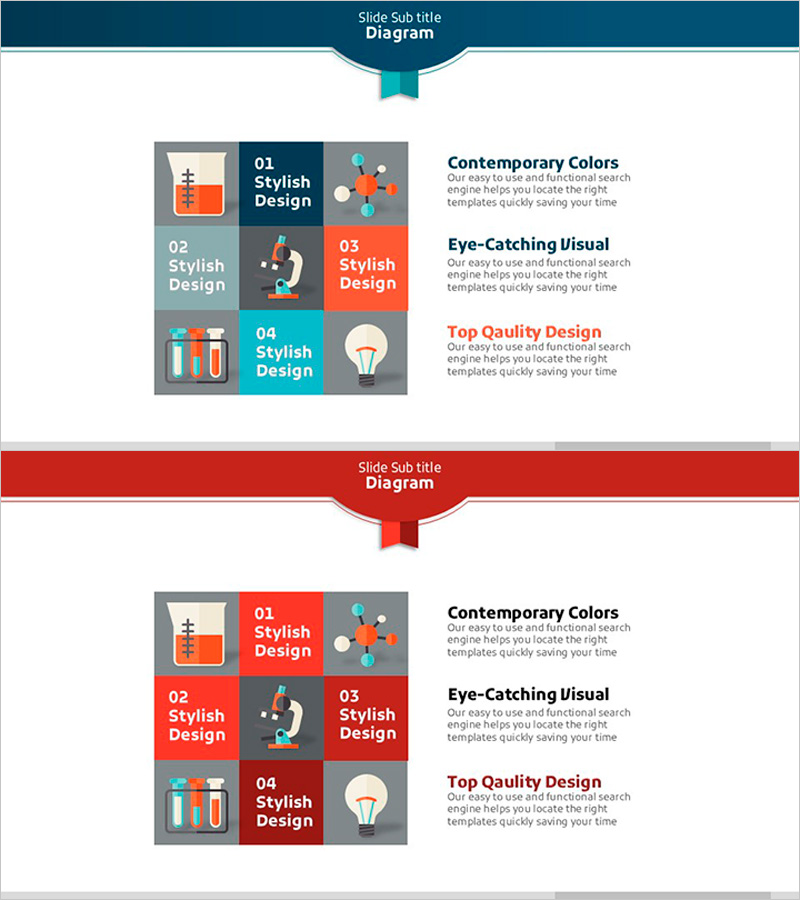
Science Icon Text Cube – A Showcase of Diverse Ideas
#Product/Service #Text Box #Composition
