Business Promotion Strategy
Profitability Analysis Segmentation Graph – Market Status and Strategy
RJ0300009_13
- Last Update 12/21/2025
- File Size 0.4MB
- # of Slides 2
- File Format PPTX
- Slide Ratio 16:9
- Color
Keywords
About the Product
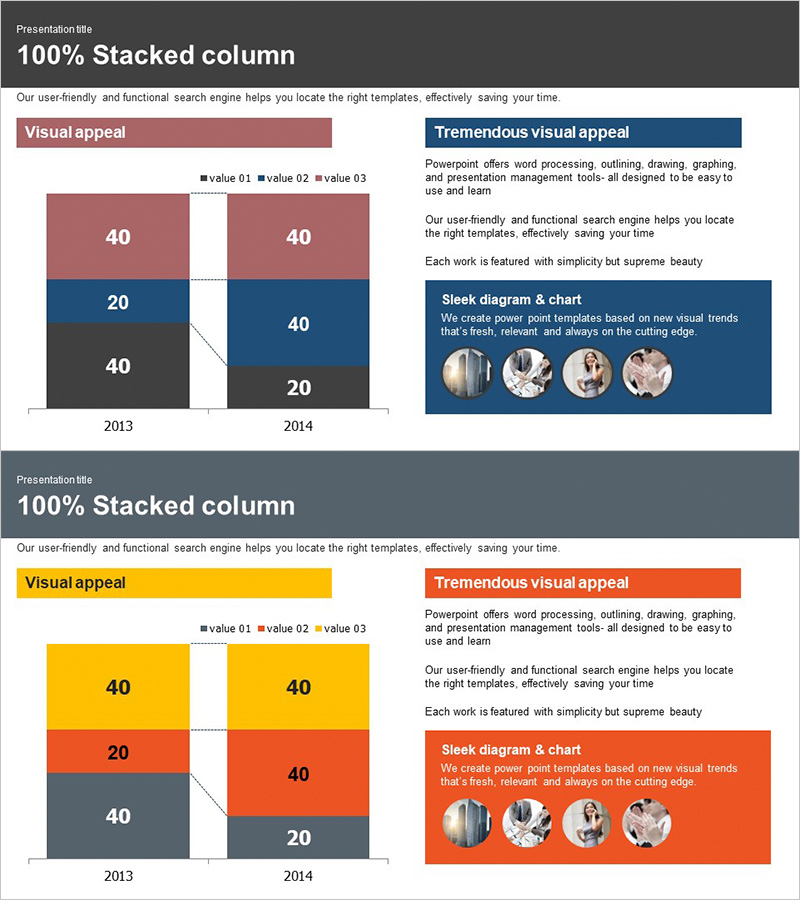
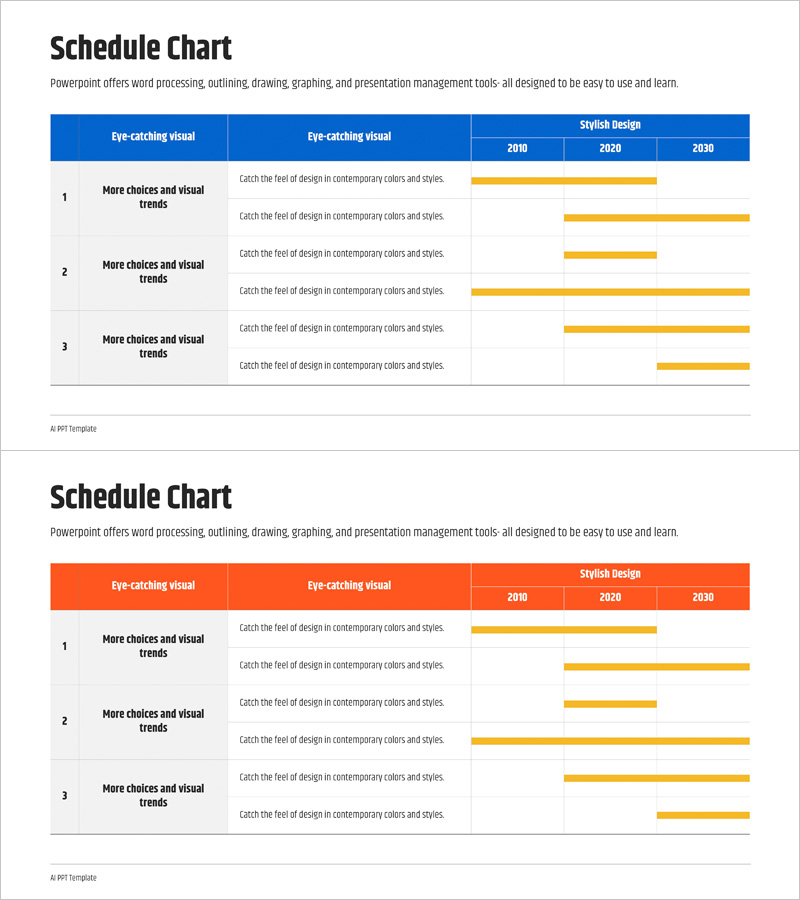
This PowerPoint slide utilizes a segmentation graph to visually represent profitability projections, clearly conveying market status and business strategies. The key colors of black, navy, and gray enhance reliability and professionalism, with a well-organized visual flow through each section. Ideal for business performance and market analysis materials, this slide allows for effective insights into profitability plans. The ease of replacing text and graphs results in a moderate editing difficulty, making it suitable for quick and convenient integration into various presentations.
Related Products
-
Trends in Usage by Transportation Type – Market Trend Analysis
#Market and Competitor Analysis #Graph #Other
-
Market Growth Chart for Business Insights
#Market and Competitor Analysis #Diagram #Graph
-
Stylish Diagram for Marketing Plan Roadmap
#Business Promotion Strategy #Diagram #Roadmap
-
Yearly Goal Setting Chart – Visualizing Business Strategy
#Business Promotion Strategy #Operation Plan #Diagram
