
Market and Competitor Analysis
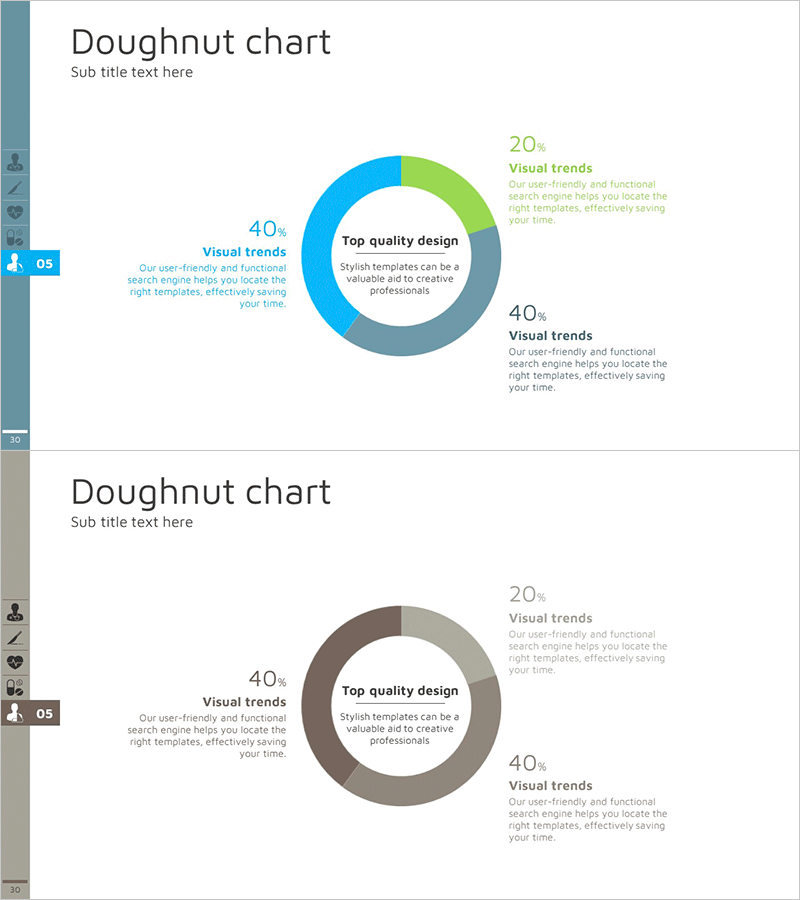
Market Share Donut Graph – Stylish Data Visualization
RJ0300003_10
- Last Update 12/21/2025
- File Size 1.4MB
- # of Slides 2
- File Format PPTX
- Slide Ratio 16:9
- Color
Keywords
About the Product
This donut chart slide is perfect for visually representing market share data. The dynamic design intuitively conveys the market share changes of each company, and the harmonious blend of green, navy, and blue colors enhances data comprehension. It can be effectively utilized for financial plan analyses and competitive analysis. The data and text areas are easy to replace, making the editing difficulty rated as 'easy'.
Related Products
-
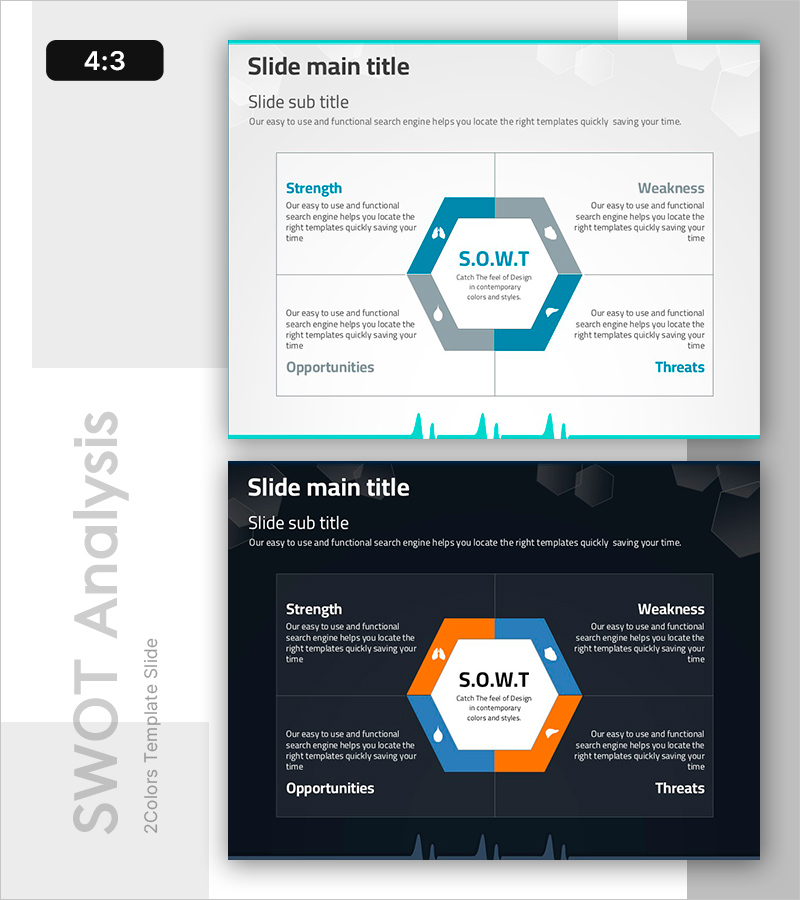
SWOT Analysis for New Drug Launch Strategy
#Market and Competitor Analysis #Diagram #SWOT Analysis
-
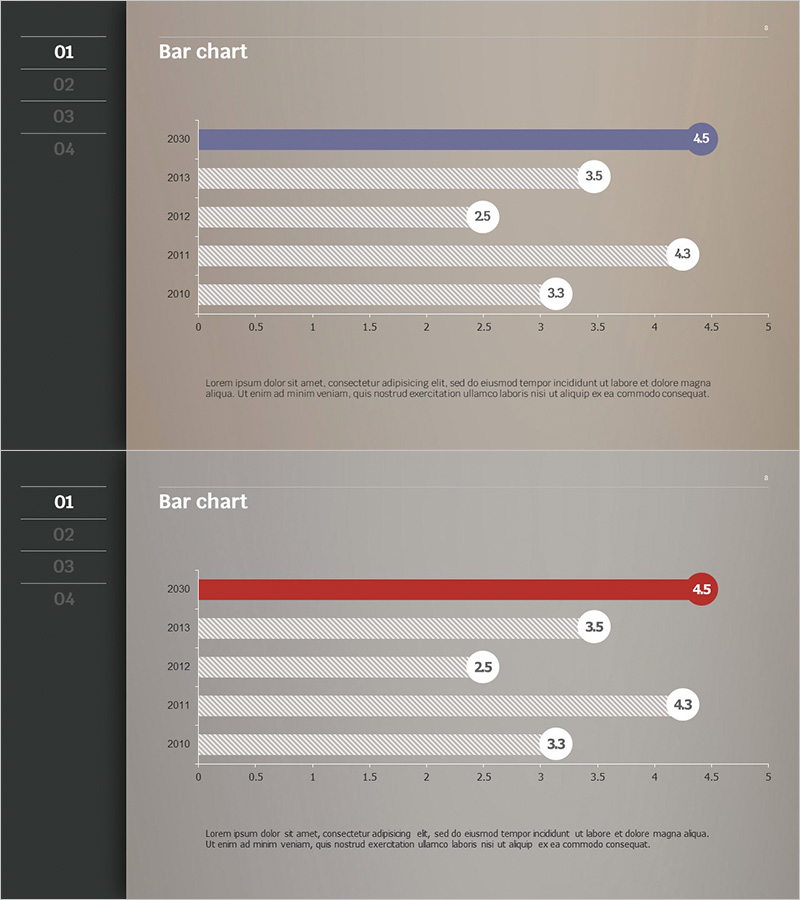
Circular Highlight Bar Graph – Optimal for Market and Competitor Analysis
#Market and Competitor Analysis #Graph #Competitor Analysis
-

Comparison Graph by Transportation Industry – Market Analysis and Financial Performance
#Market and Competitor Analysis #Financial Plans and Performance #Graph
-
Blue Gray Donut Circle Graph - Visualizing Market Share
#Market and Competitor Analysis #Graph #Market Share
