Business Introduction
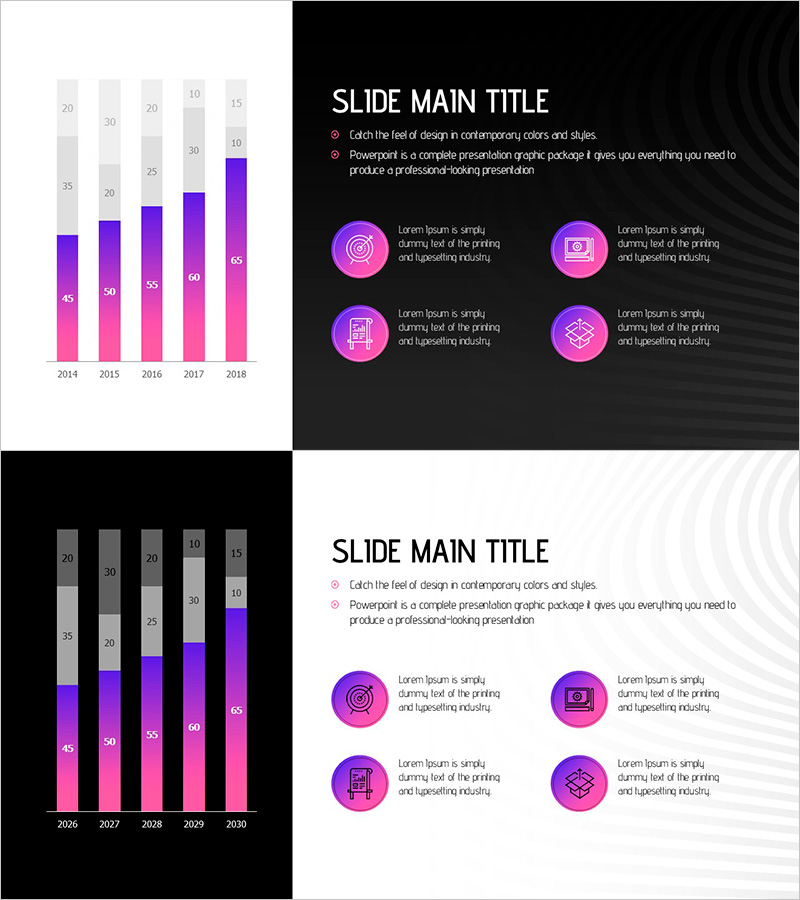
Fantastic Wide PPT Vertical Bar Segmentation Chart – Visualization of Business Strategy
RJ0200049_19
- Last Update 12/21/2025
- File Size 0.5MB
- # of Slides 2
- File Format PPTX
- Slide Ratio 16:9
- Color
Keywords
About the Product
This PowerPoint slide features a fantastic vertical bar chart designed for segmentation, effectively conveying the changes and trends in data. It clearly showcases the revenue models and business development progress from 2014 to 2030, leaving a strong visual impression. Dominated by purple hues, the chart neatly presents segmented data for each year. This slide is ideal for business introductions and strategies, and can be used in team meetings, investment briefings, and reports. Text and data fields are easy to replace, making the editing difficulty rated as 'easy'.
Related Products
-
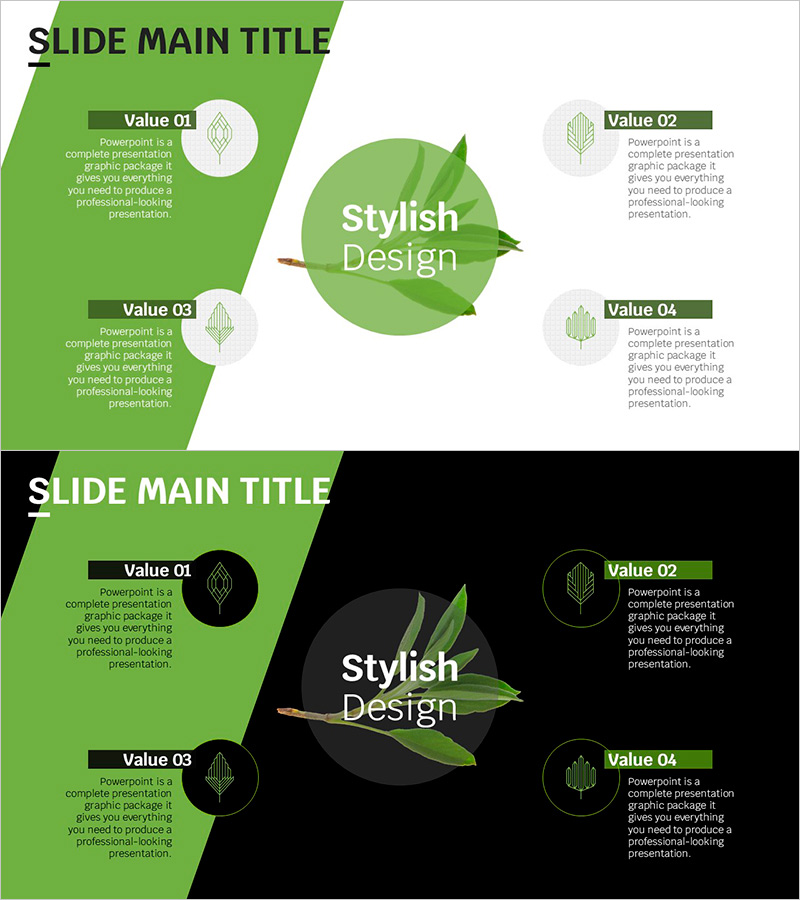
Trend Color Wide Template Diagram – Business Vision and Strategy
#Business Introduction #Business Vision and Strategy #Diagram
-

Simple Car Presentation Slide – Innovation and Future Planning
#Business Promotion Strategy #Technology Sector #Innovative Technology and Future Plans
-
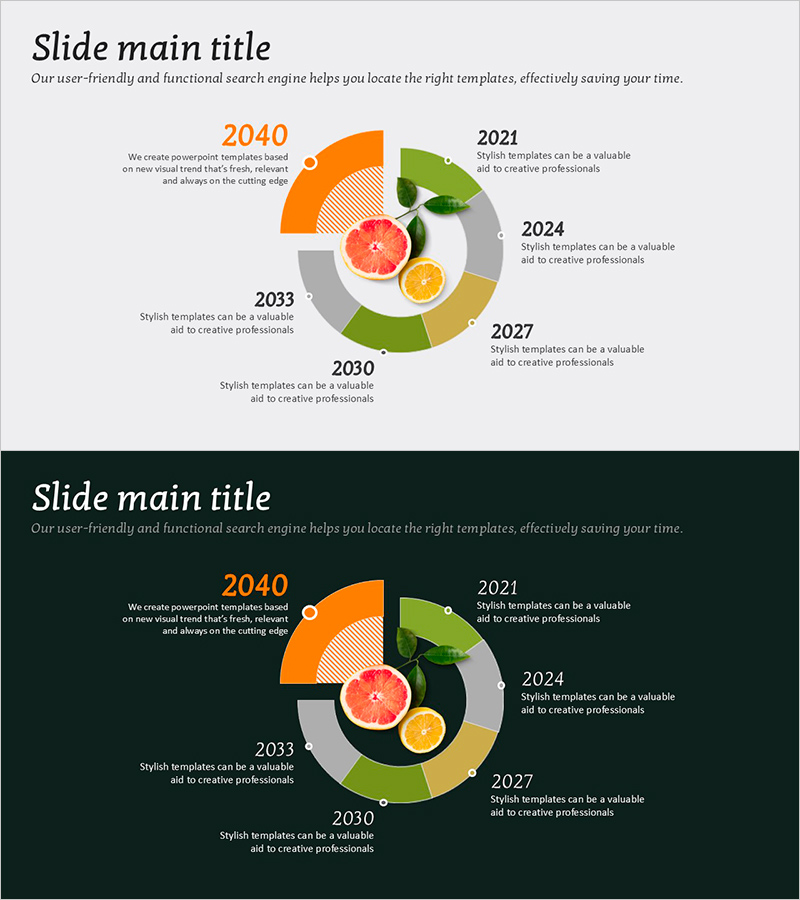
Maximizing Business Strategies with the Fruit Slice Year Chart – Key to Success
#Company Introduction #Business Promotion Strategy #Graph
-
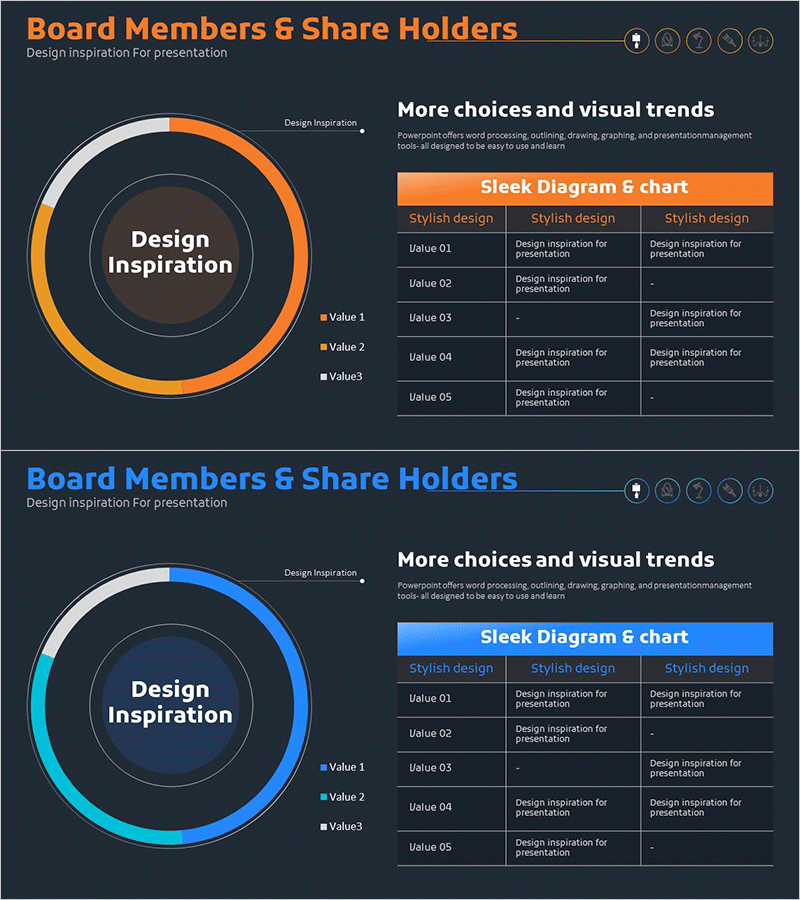
Development Status Analysis Chart - Visualization for Effective Market Analysis
#Product/Service #Market and Competitor Analysis #Diagram
