Company Introduction
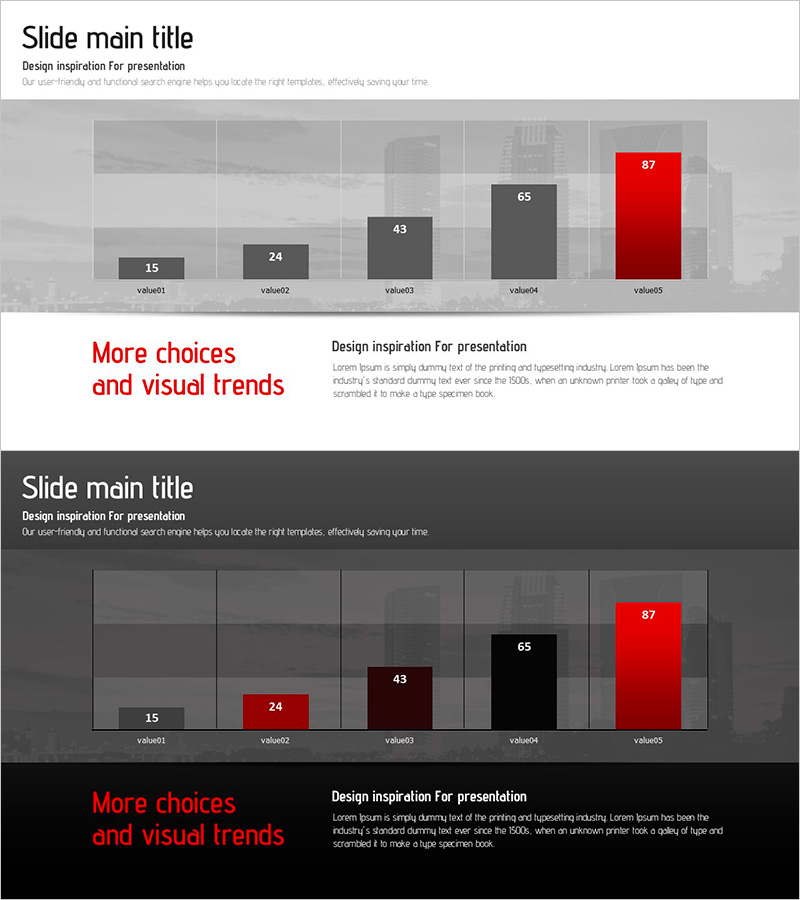
Vertical Bar Graph for Vision Growth – Business Development Strategy
RJ0200042_9
- Last Update 12/21/2025
- File Size 1MB
- # of Slides 2
- File Format PPTX
- Slide Ratio 16:9
- Color
Keywords
About the Product
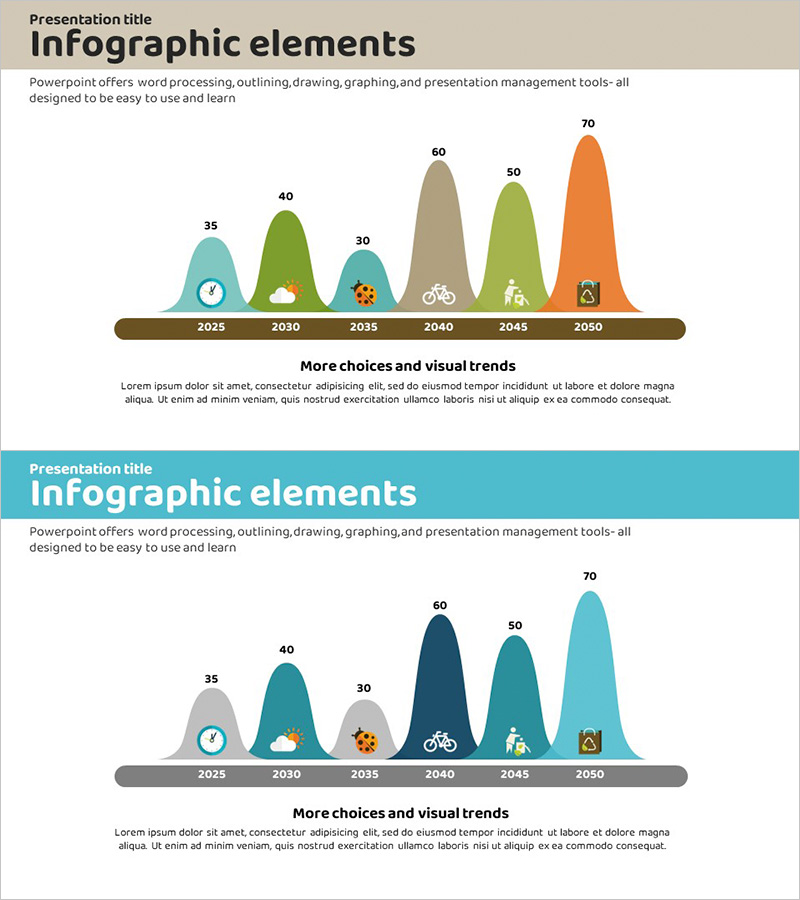
This slide features a vertical bar graph designed to intuitively present the progress of vision growth. Each graph emphasizes key achievements, and the combination of blue and orange colors provides a trustworthy design. It is suitable for showcasing your business vision and growth performance, and the simple data structure allows for quick and easy integration into various corporate presentations.
Related Products
-
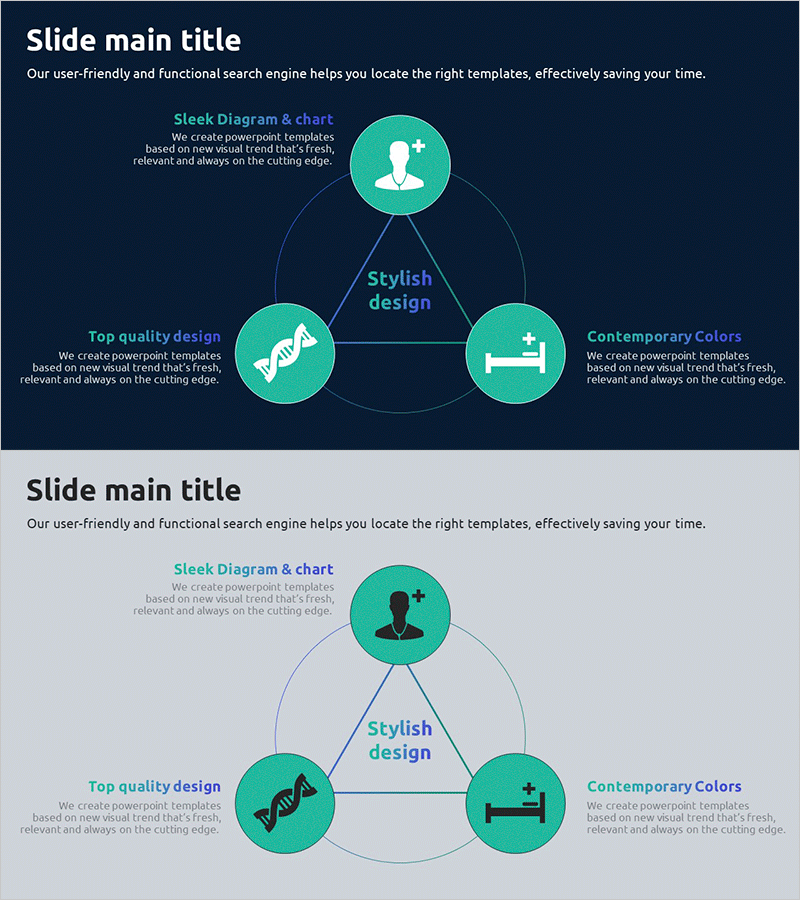
Smart Healthcare Business Area Slide – Innovation and Motivation
#Company Introduction #Business Introduction #Diagram
-
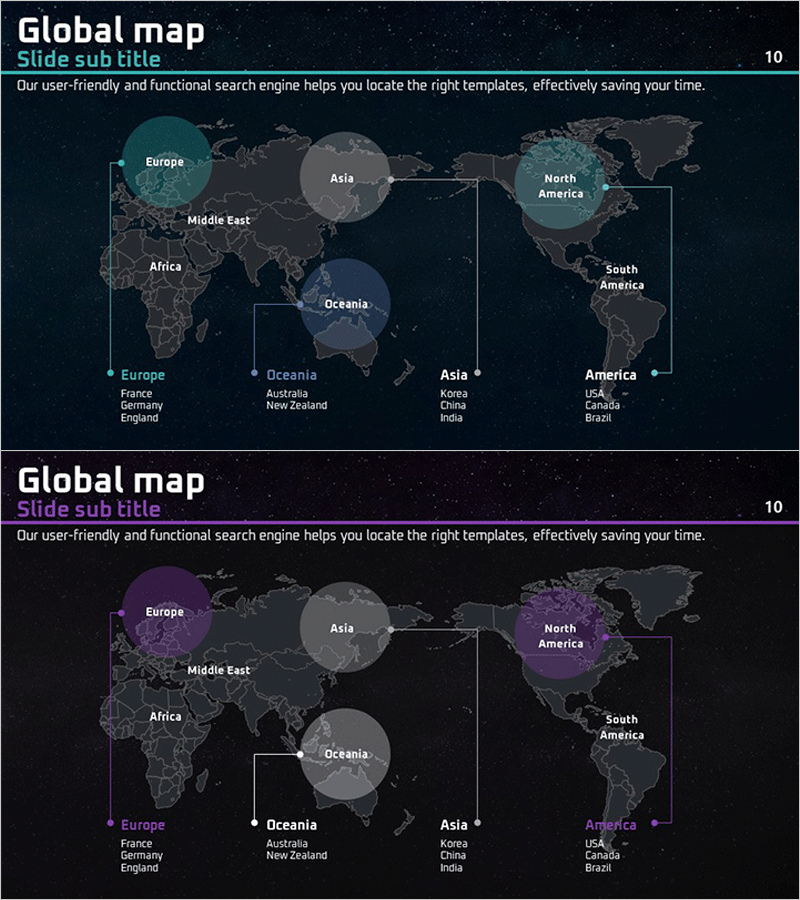
Space Themed World Map – Visualizing Global Networks
#Company Introduction #Market and Competitor Analysis #Marketing Plan and Strategy
-
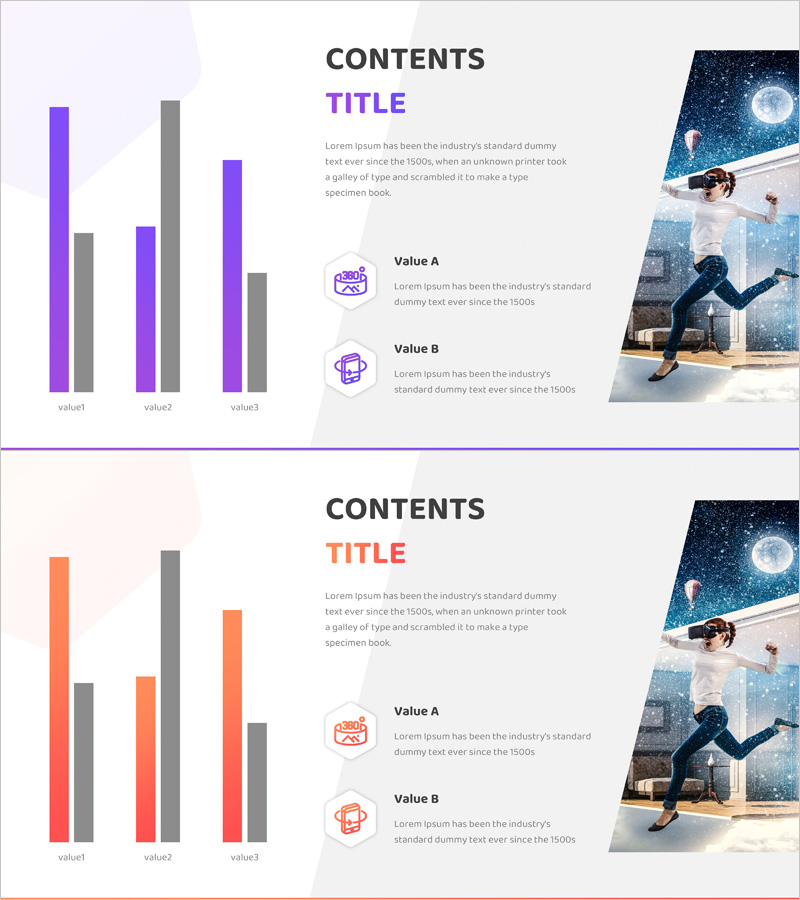
VR Market Analysis Bar Graph
#Market and Competitor Analysis #Diagram #Graph
-
Carbon Neutral Infographic Wave Chart
#Market and Competitor Analysis #Graph #Competitor Analysis
