Company Introduction
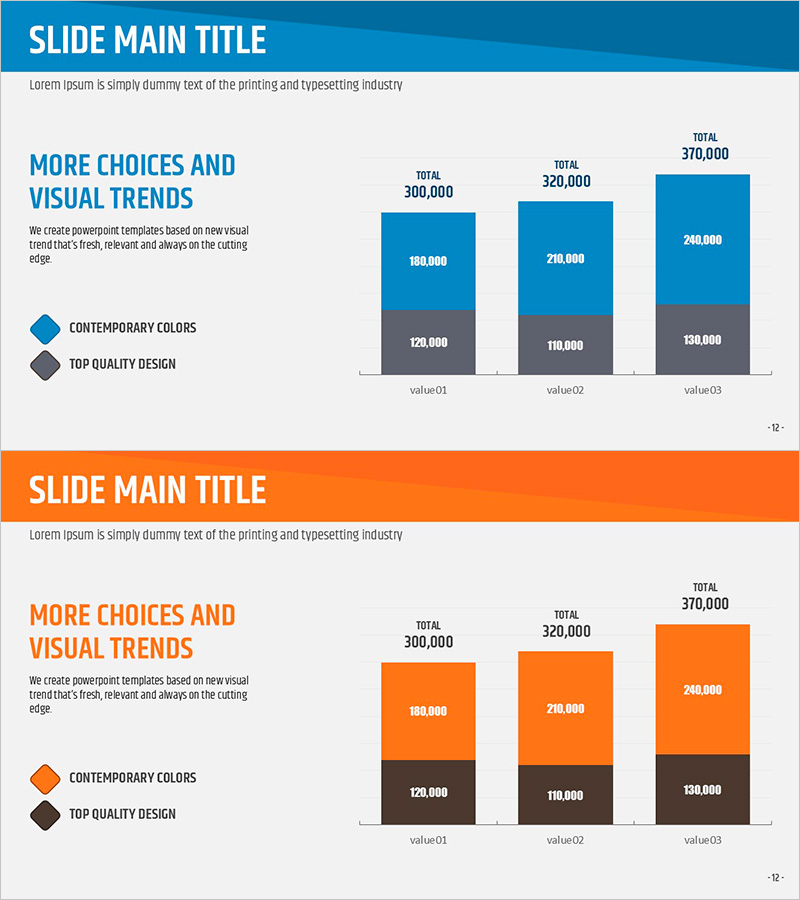
Vertical Bar Segmentation Graph – Business Performance and Revenue Outlook
RJ0200041_11
- Last Update 12/21/2025
- File Size 0.2MB
- # of Slides 2
- File Format PPTX
- Slide Ratio 16:9
- Color
Keywords
About the Product
This slide utilizes a vertical bar chart to effectively visualize business performance and revenue outlook. The segmented data clearly shows the contribution of each result, while the modern design with a combination of orange and blue captivates the audience. Our origami presentation template is well-suited for meeting materials, investment presentations, and business proposals, helping to convey vision and goals effectively. Text and data fields are easily replaceable, with an editing difficulty rated as 'easy' for straightforward customization.
Related Products
-
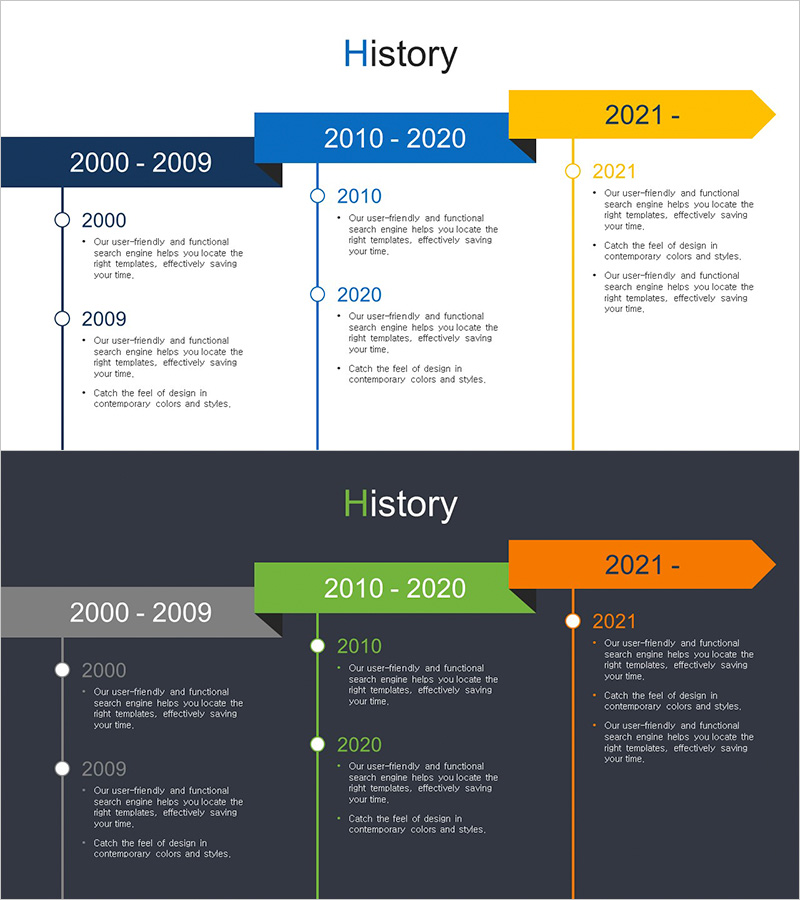
Business Step-by-Step History Diagram – Systematic Flow and Clear Information Delivery
#Company Introduction #Diagram #History
-
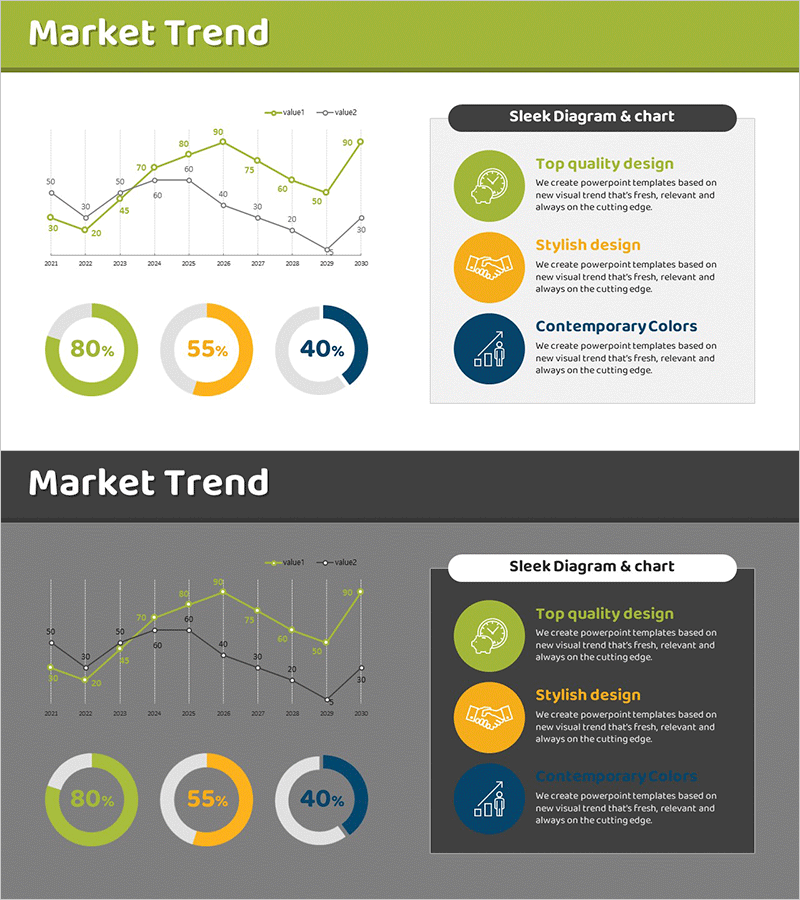
Market Trend Analysis Charts & Diagrams – Essential Tool for Competitor Analysis
#Market and Competitor Analysis #Graph #Competitor Analysis
-
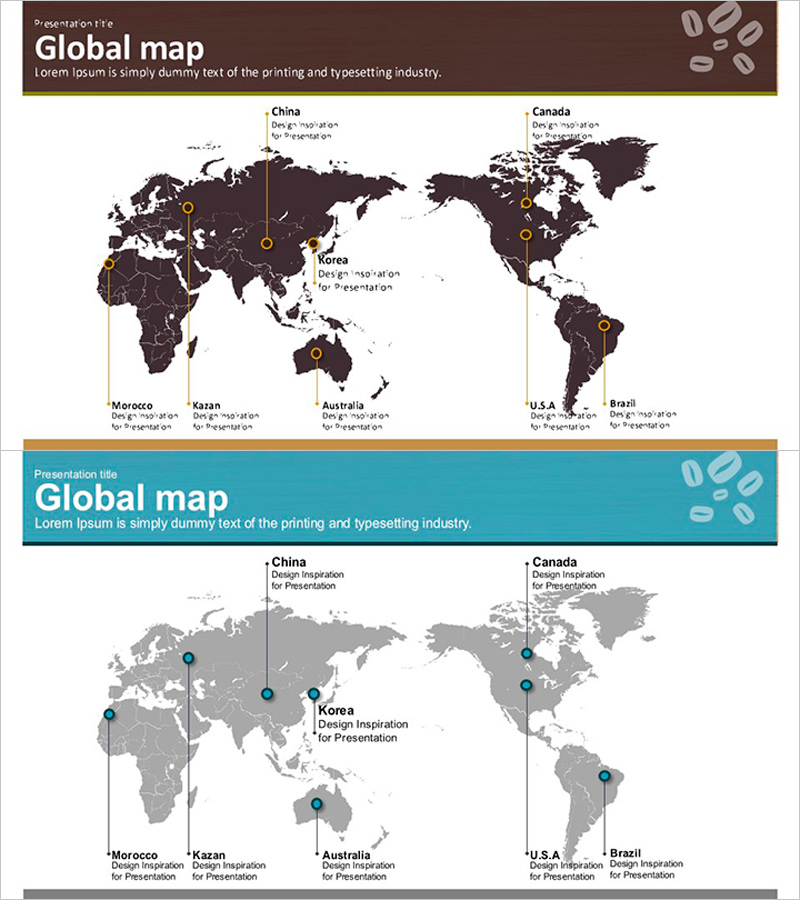
Survey of Coffee Bean Production – Exploring Global Markets
#Company Introduction #Market and Competitor Analysis #Other
-
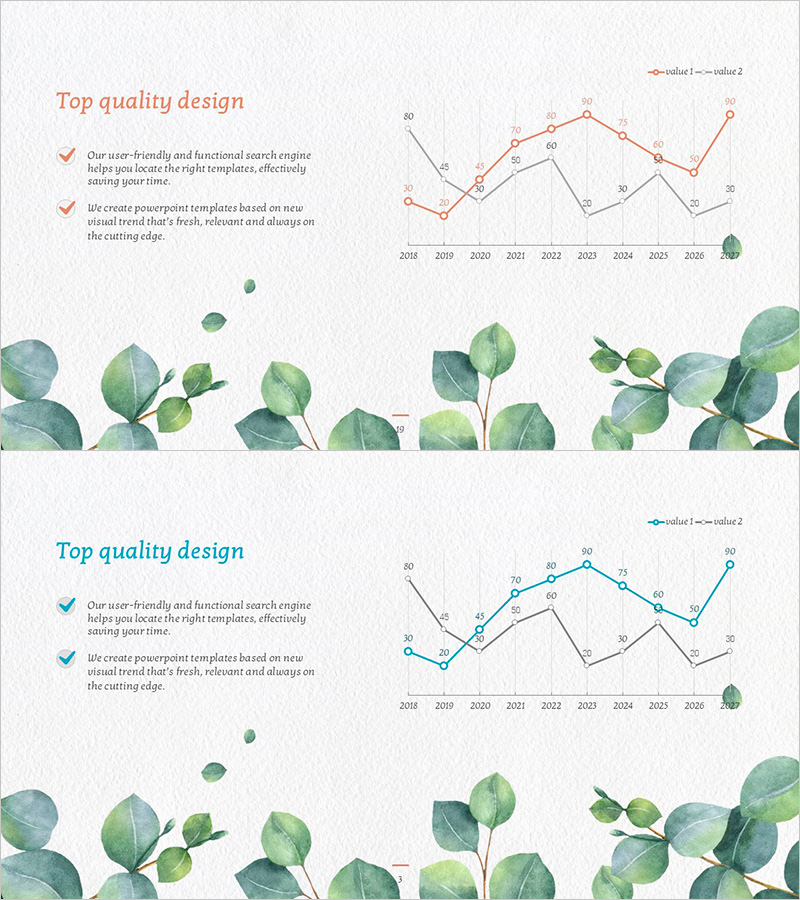
Eucalyptus Bending Line Chart – Market and Performance Analysis
#Business Promotion Strategy #Market and Competitor Analysis #Graph
