Company Introduction
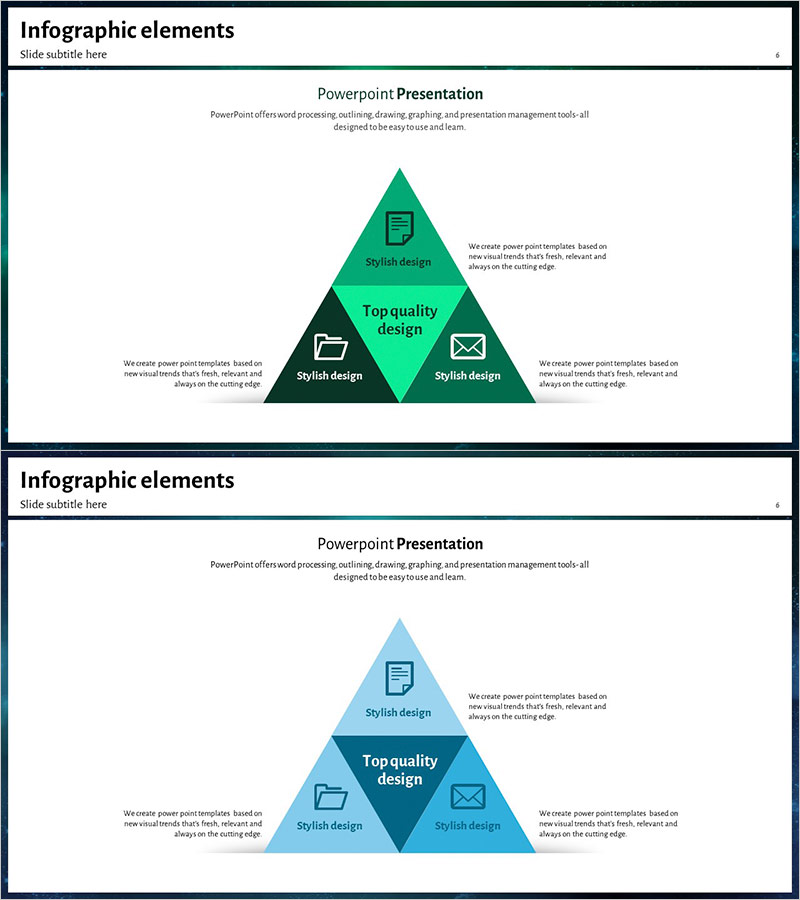
Cluster Connection Triangle Diagram – Visualizing Business Areas
RJ0200019_5
- Last Update 12/21/2025
- File Size 7.2MB
- # of Slides 2
- File Format PPTX
- Slide Ratio 16:9
- Color
Keywords
About the Product
This slide features a cluster connection triangle diagram effectively visualizing business areas. Each cluster represents key aspects of the business, highlighting interconnectivity to convey a clear message. The green and blue hues provide a sense of trust and stability, while the clean layout enhances clarity of information delivery. It's well-suited for business presentations or strategic discussions and aids in quickly understanding the overarching content or concepts. Text and graphic elements are easily interchangeable, with an editing difficulty rated as 'easy', enabling application across various presentations.
Related Products
-
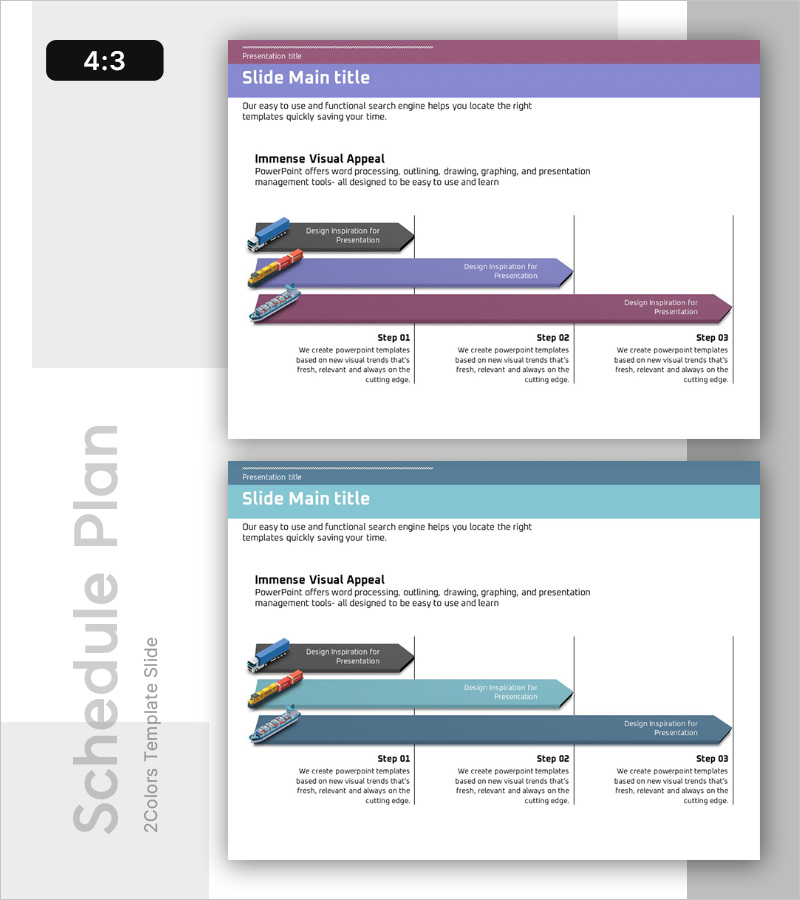
Trade Schedule and Stages – Step-by-Step Approach
#Business Promotion Strategy #Business Management #Diagram
-
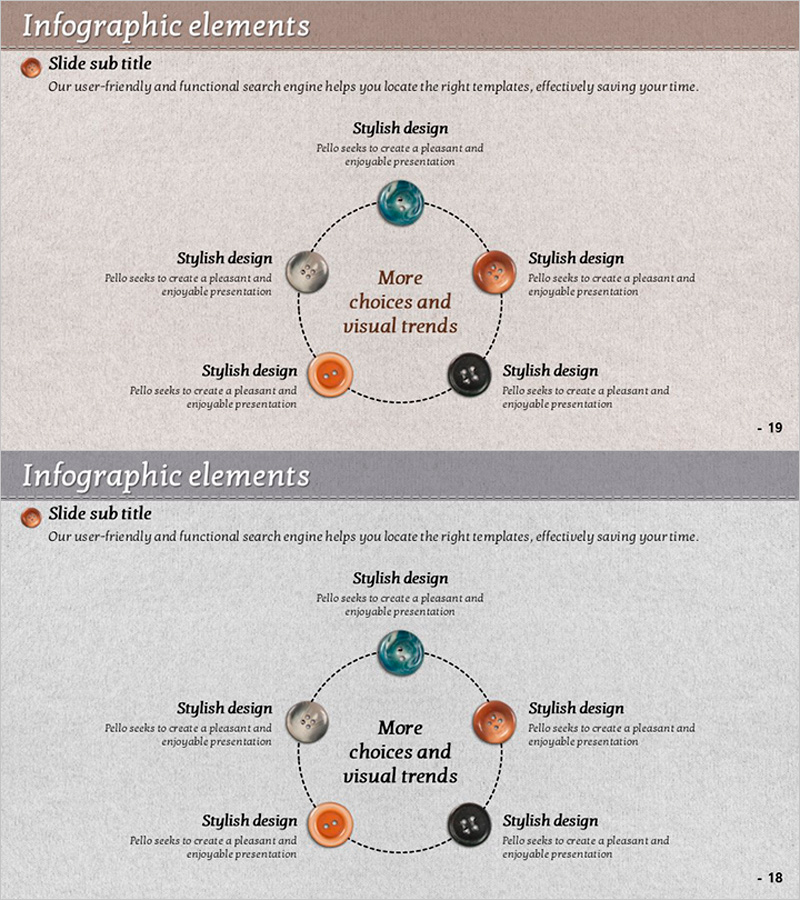
Sewing Button Diagram – Business Area and Technical Status
#Business Introduction #Diagram #Business Areas
-

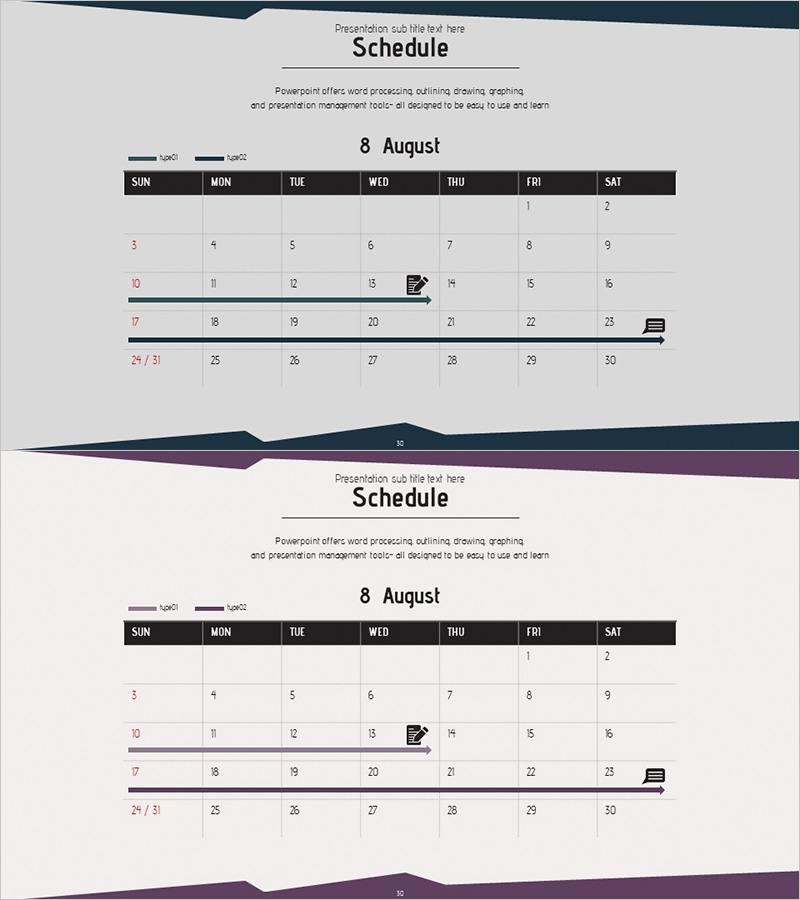
Calendar Illustration Table – Visualizing Business Strategy
#Business Promotion Strategy #Business Management #Diagram
-
Business Promotion Schedule Slide – A Roadmap for Efficient Operations
#Business Promotion Strategy #Operation Plan #Diagram
