
Product/Service
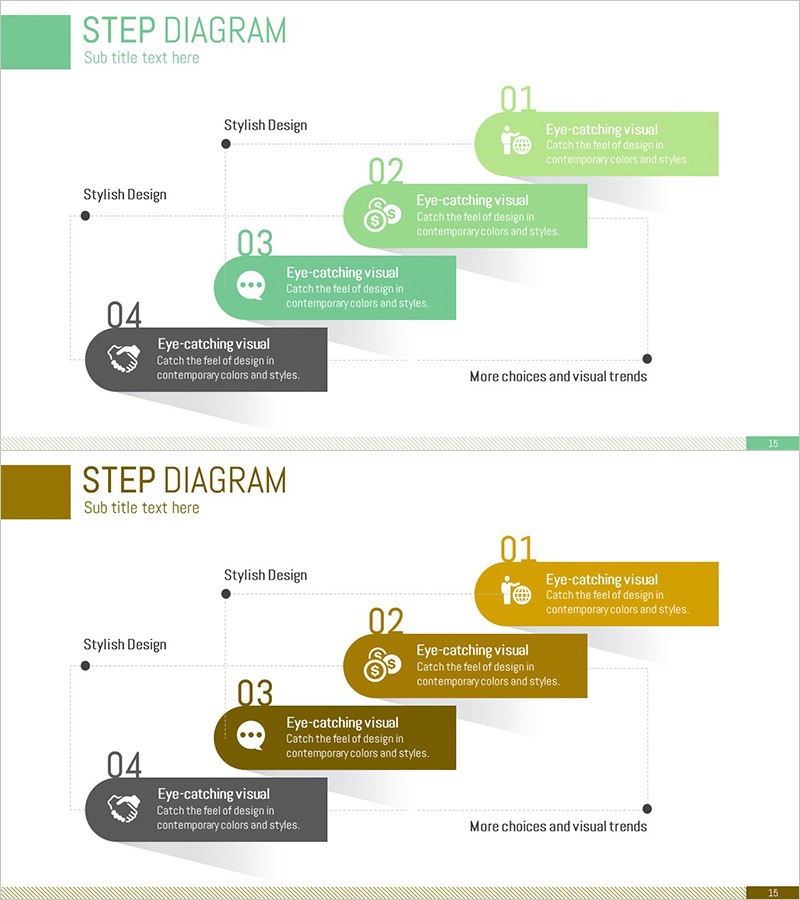
Interrelationships between Critical Business Areas – Cluster Diagram
RB0800077_9
- Last Update 12/21/2025
- File Size 0.5MB
- # of Slides 2
- File Format PPTX
- Slide Ratio 4:3
- Color
Keywords
- #Content-Based Slides
- #Design-Based Slides
- #Product/Service
- #Business Vision and Strategy
- #Diagram
- #Features
- #Business Strategy
- #Cluster
- #Combination Diagram
- #4:3
- #Business Strategy
- #Interrelationships
- #Cluster
- #Diagram
- #Business Vision
- #Partnership
- #Service
- #Product
- #Characteristics
- #Business Introduction
About the Product
This slide features a cluster diagram that visually represents the interrelationships between critical business areas. It emphasizes how each element connects, making it suitable for topics like business strategy or product/service introduction. The design uses vibrant blue and yellow colors for clear visibility, and the text replacement is simple, rating the editing difficulty as 'easy'. It is particularly useful for effectively conveying core information in corporate presentations. It can be utilized for various business analysis or strategic meeting materials.
Related Products
-

Bank Income Statement – Visualizing Financial Performance
#Financial Plans and Performance #Diagram #Income Statement
-
Business Transaction Steps Procedure Visualization Diagram
#Business Promotion Strategy #Business Management #Diagram
-
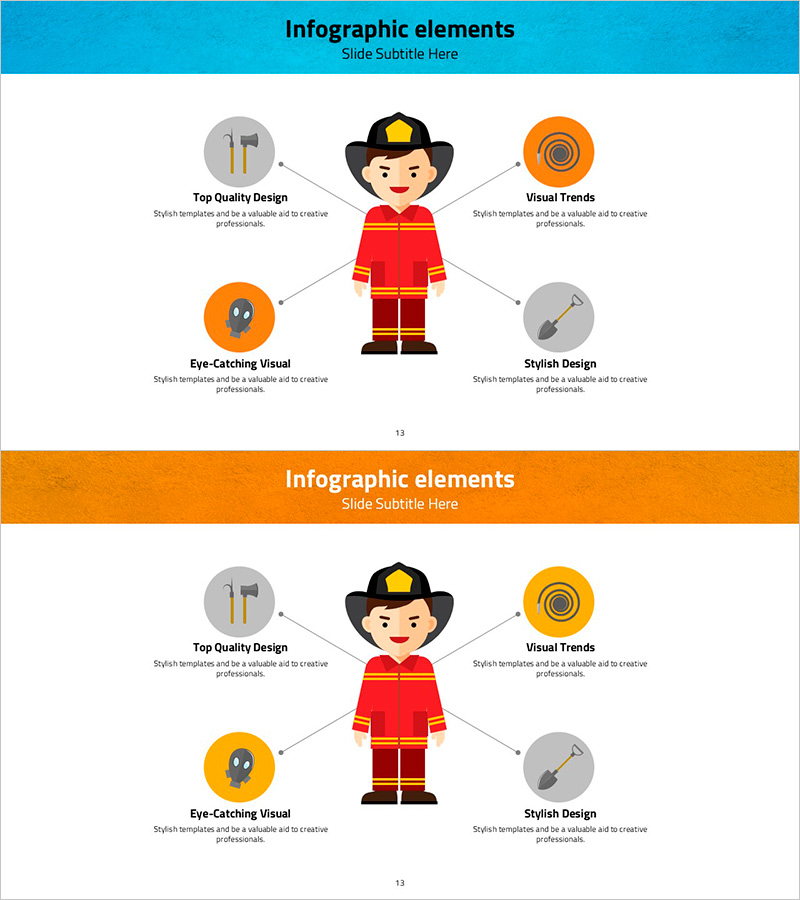
Firefighter Illustration Infographic – Eye-Catching Visuals
#Product/Service #Business Introduction #Diagram
-
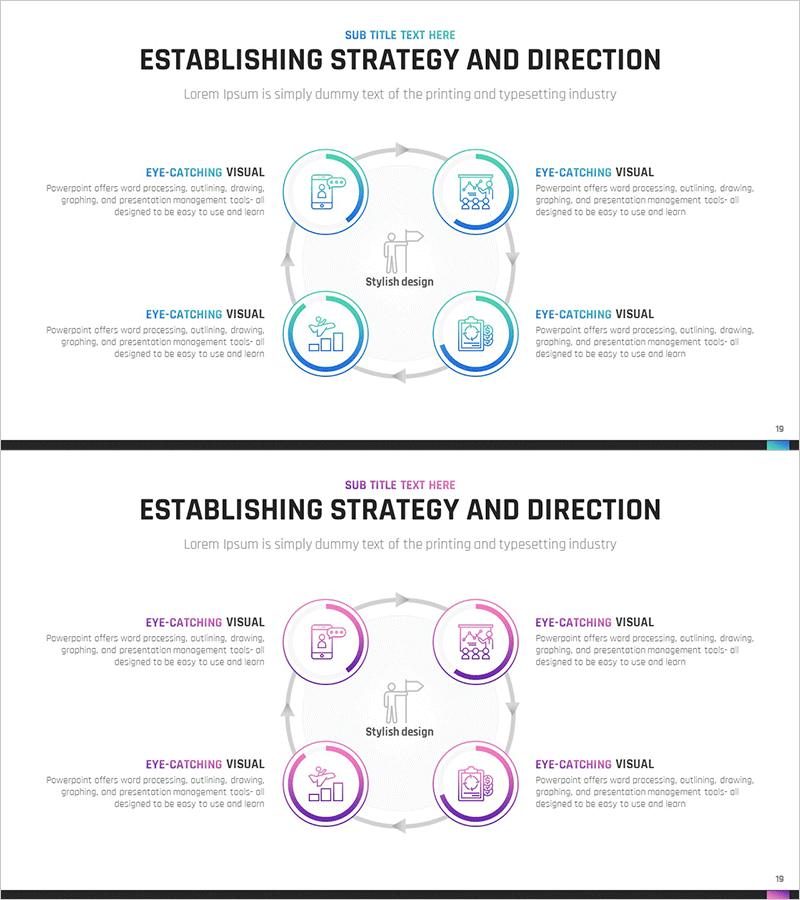
Business Strategy Direction Diagram – Establishing Business Vision
#Business Vision and Strategy #Marketing Plan and Strategy #Diagram
