Company Introduction
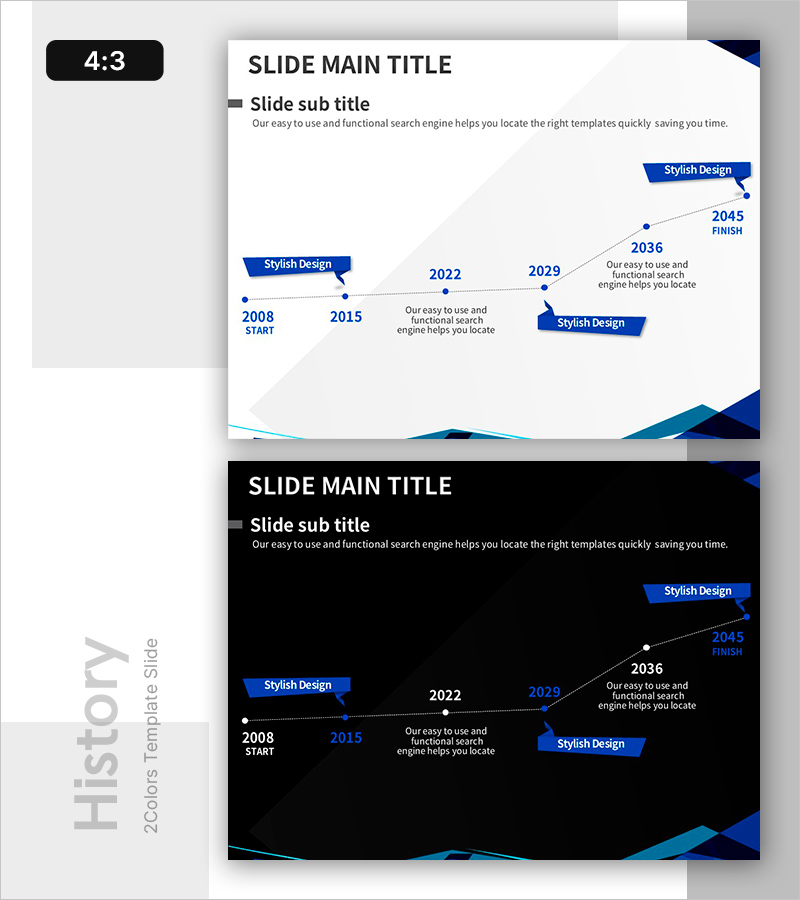
Milestones in Strategic Growth – Company Timeline Diagram
RB0800044_4
- Last Update 12/21/2025
- File Size 5.6MB
- # of Slides 2
- File Format PPTX
- Slide Ratio 4:3
- Color
Keywords
About the Product
This slide showcases key milestones in strategic growth through a visually engaging timeline diagram. Featuring a linear flow design, it highlights significant growth stages across the years (2008, 2015, 2022, 2029, 2036, 2045) in a clear manner. The blue background contrasted with white text creates a trustworthy impression, enhancing the professionalism of the presentation. This slide is ideal for presenting a company’s growth trajectory and effectively communicates business objectives and milestones to clients or investors. The editing difficulty is rated as 'easy', allowing for straightforward updates to text and elements.
Related Products
-

Blue Gray Table Chart – Stylish Data Representation
#Diagram
-

Four Color Infographic Presentation Template Pyramid Structure – A Tool for Marketing Goal Achievement
#Marketing Plan and Strategy #Diagram #Marketing Objectives
-
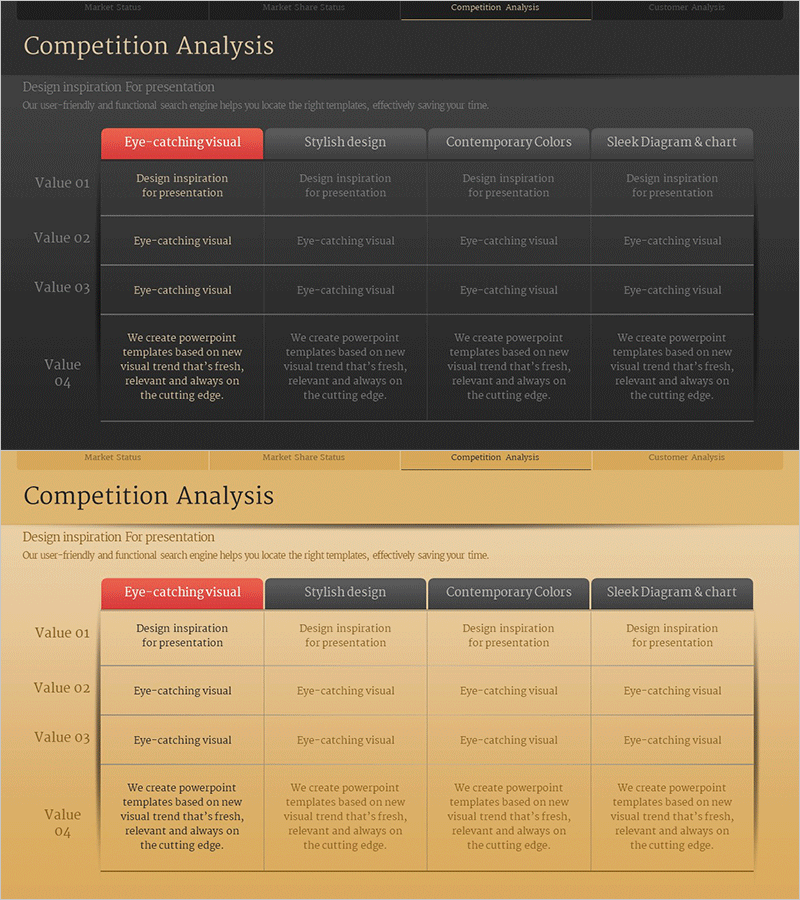
Competitor Analysis Graph – Quickly Convey Market Share
#Market and Competitor Analysis #Diagram #Competitor Analysis
-
Rainbow Template for Financial Planning & Performance Charts and Icons
#Financial Plans and Performance #Diagram #Balance Sheet
