Business Introduction
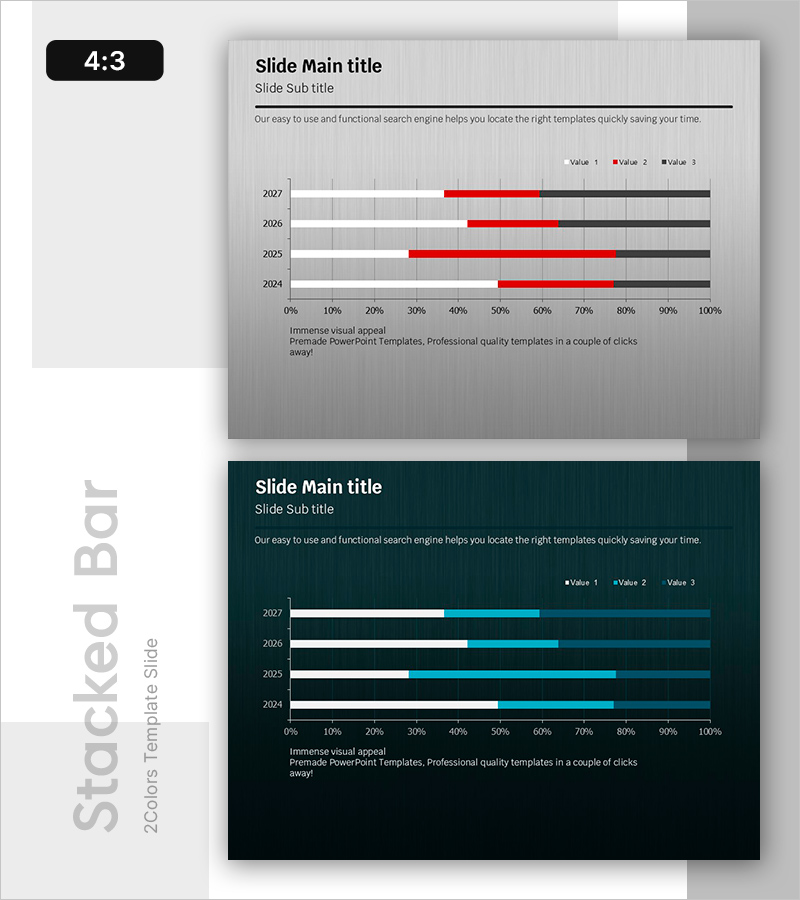
Bar Chart of Key Segments – Data Analysis and Performance Visualization
RB0800026_15
- Last Update 12/21/2025
- File Size 1.1MB
- # of Slides 2
- File Format PPTX
- Slide Ratio 4:3
- Color
Keywords
About the Product
This slide features a premium PowerPoint template that visually conveys data of key segments using a bar chart. Its design allows for easy comparison and analysis of data, characterized by a harmonious combination of white, red, and turquoise colors. This slide is suitable for presentations emphasizing business introductions and performance, making it useful for presenting medium-sized business results or market share changes effectively. Furthermore, it's ideal for management strategy meetings or investment proposals where changes in values need to be analyzed at a glance.
Related Products
-
Company Overview & Background Introduction Slides – Foundation of Business
#Company Introduction #Business Introduction #Diagram
-
Product Segmentation Analysis Chart – Market Analysis and Strategy
#Business Promotion Strategy #Market and Competitor Analysis #Graph
-
Work Progress Analysis Graph – Market Share Visualization
#Market and Competitor Analysis #Graph #Market Share
-

Market Analysis Bundle Bar Graph - Effective Competitor Analysis
#Market and Competitor Analysis #Graph #Competitor Analysis
