Market and Competitor Analysis
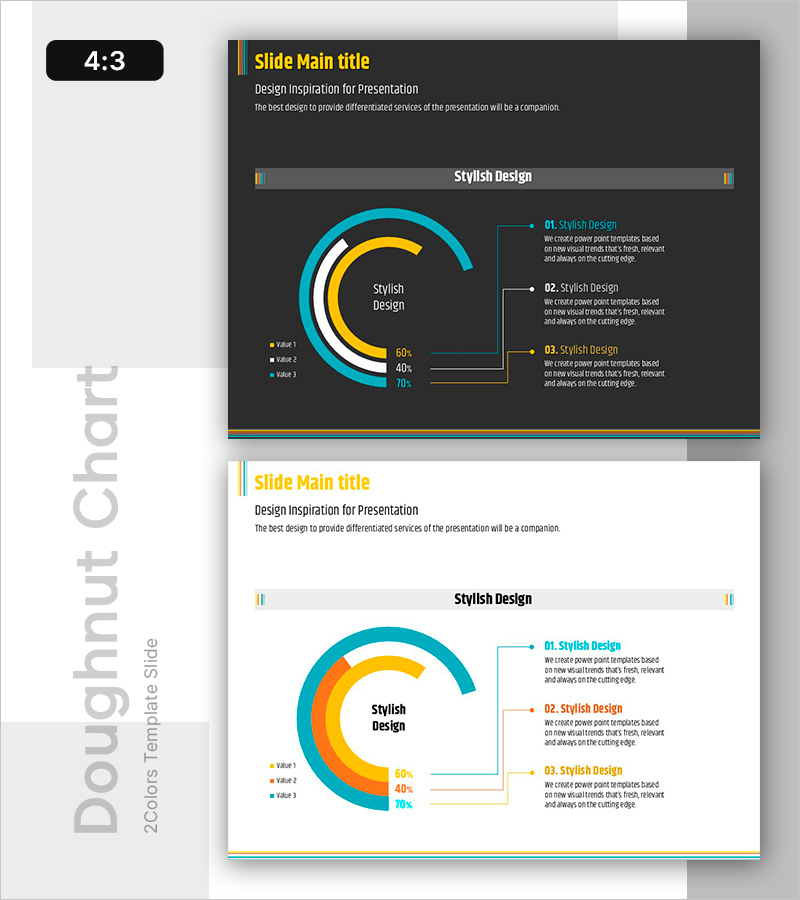
Current Status as Seen in a Donut Chart – Slide Representing Competitive Advantage
RB0800025_9
- Last Update 12/21/2025
- File Size 0.2MB
- # of Slides 2
- File Format PPTX
- Slide Ratio 4:3
- Color
Keywords
About the Product
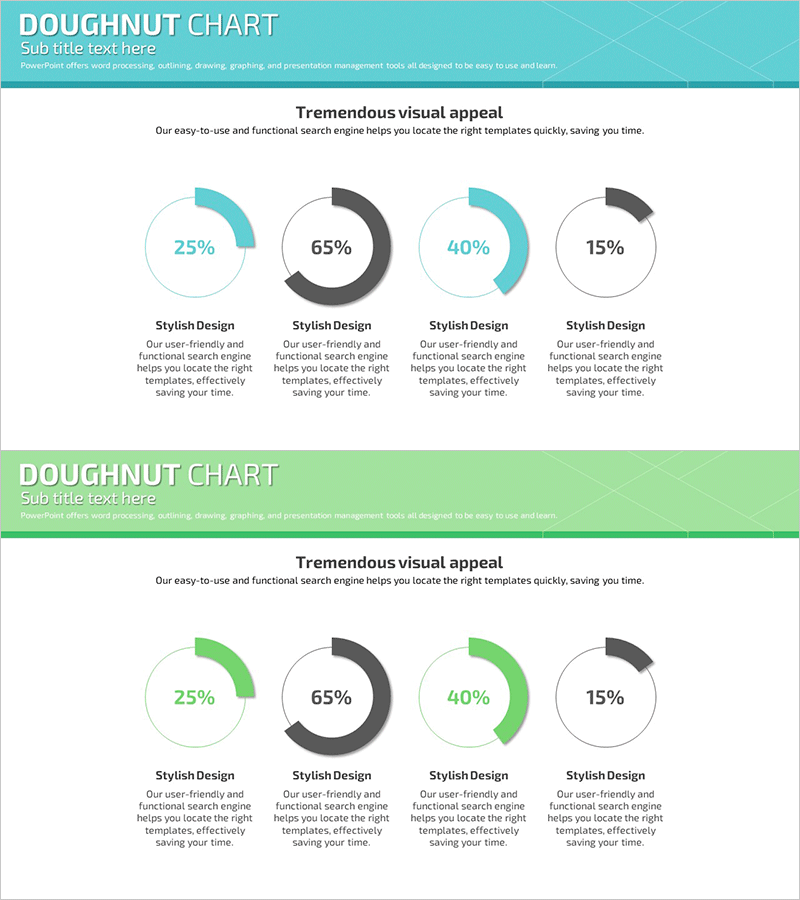
This slide utilizes a donut chart to intuitively represent market status and competitive advantages. Designed with eye-catching yellow and teal, it's structured to allow easy comparison of data at a glance. The donut chart emphasizes the proportion of each component, making it useful for data analysis or reporting. The stylish design of the slide is suitable for professional presentations, particularly in public institutions, corporate reports, and business proposals.
Related Products
-

Preferred Age Group by Travel Destination in India Green Red
#Market and Competitor Analysis #Graph #Market Analysis
-
Infographic Slide for Competition Tournaments and Player Arrangements
#Company Introduction #Market and Competitor Analysis #Diagram
-
Development Status Donut-Shaped Circle Graph – Visualizing Market Share
#Product/Service #Market and Competitor Analysis #Graph
-

Startup Business Global Market Strategy – Market Analysis and Goal Setting
#Company Introduction #Marketing Plan and Strategy #Graph
