Product/Service
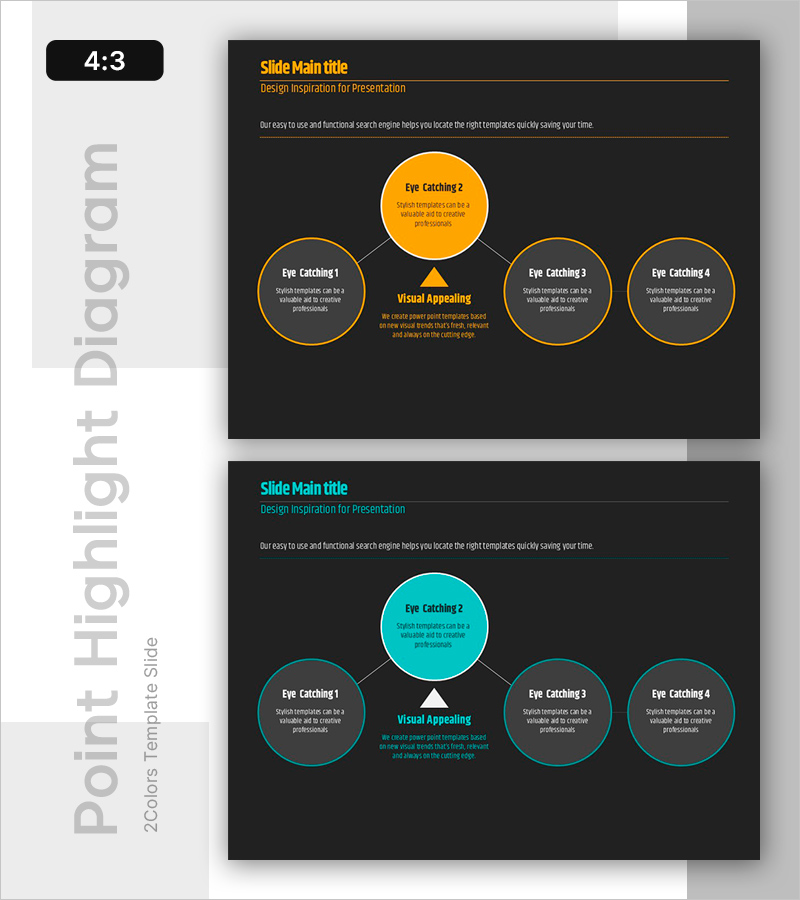
Connection Diagram and Highlighted Areas – Effective Service Introduction
RB0800014_9
- Last Update 12/21/2025
- File Size 0.1MB
- # of Slides 2
- File Format PPTX
- Slide Ratio 4:3
- Color
Keywords
- #Content-Based Slides
- #Design-Based Slides
- #Product/Service
- #Operation Plan
- #Technology Sector
- #Diagram
- #Text Box
- #Differentiation Strategy for Products/Services
- #Organization and Personnel Plan
- #Service Composition
- #Cluster
- #Chain Diagram
- #4:3
- #connection diagram
- #highlighted areas
- #product introduction
- #operational plan
- #technical section
About the Product
This slide uses a connection diagram to effectively convey the structure and differentiated features of products/services. The blend of teal and yellow is visually striking, maximizing information delivery through its layout. It is particularly suitable for operational plans and technical sections, emphasizing service content well. With text box and cluster elements, complex information is simply restructured, making it a practical tool for various business situations. The editable elements include text and images, with an overall editing difficulty rated as 'easy'.
Related Products
-
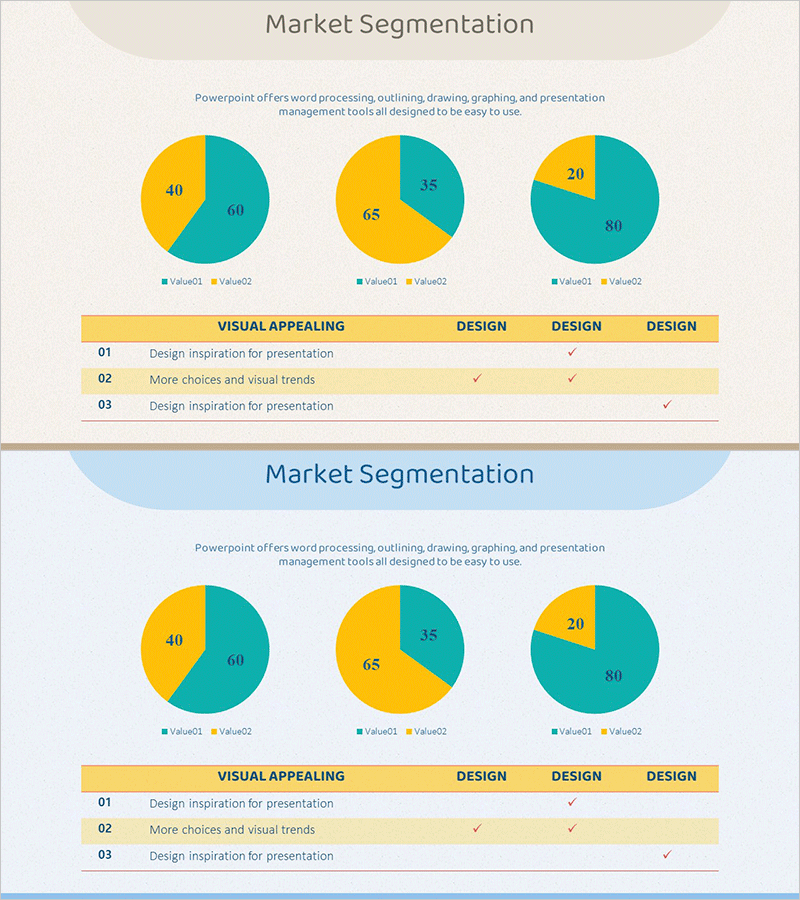
Performance Analysis Pie Chart – Market Share Visualization
#Market and Competitor Analysis #Diagram #Graph
-
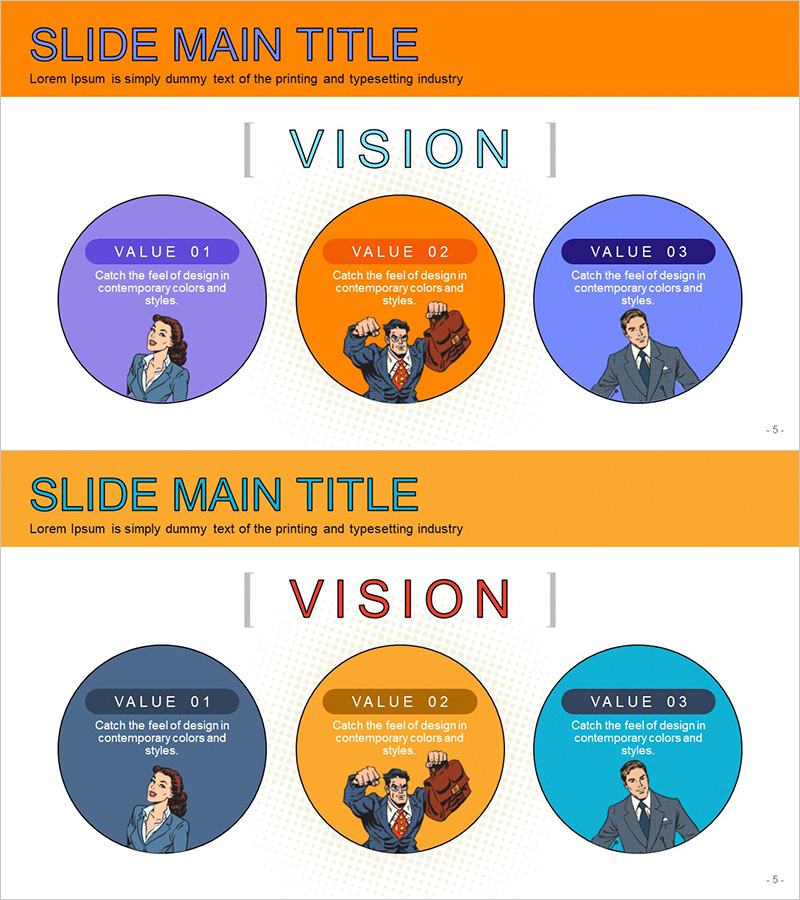
Cartoon Vision Diagram – Effective Delivery of Business Vision
#Business Vision and Strategy #Diagram #Business Vision
-
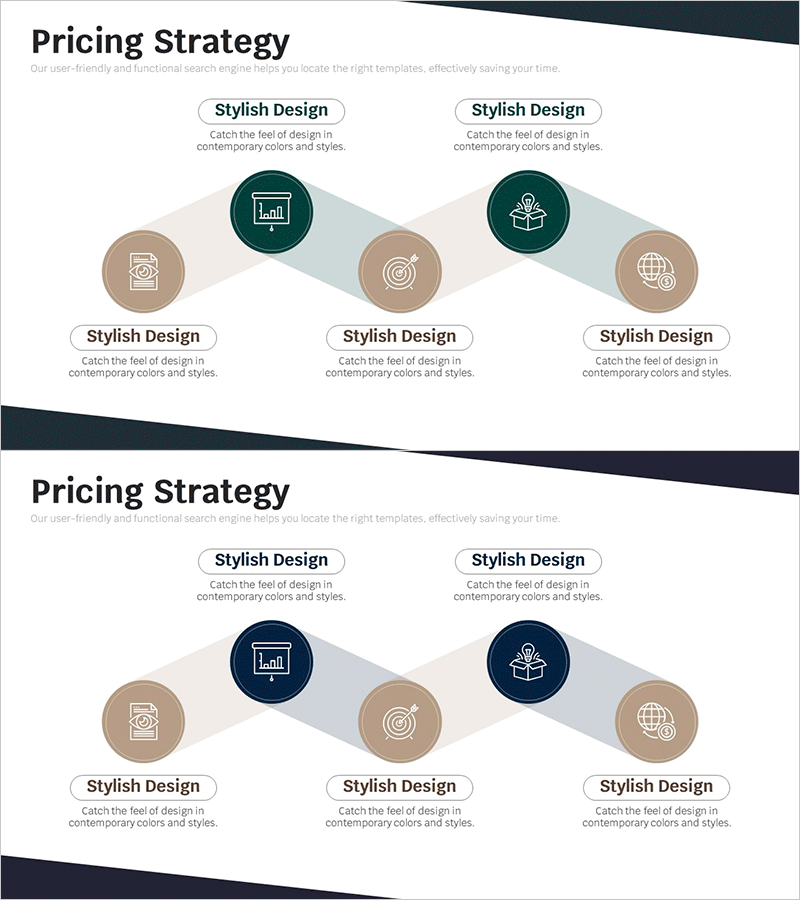
Pricing Strategy Connection Diagram – Cluster for Efficient Business Implementation
#Business Promotion Strategy #Marketing Plan and Strategy #Diagram
-
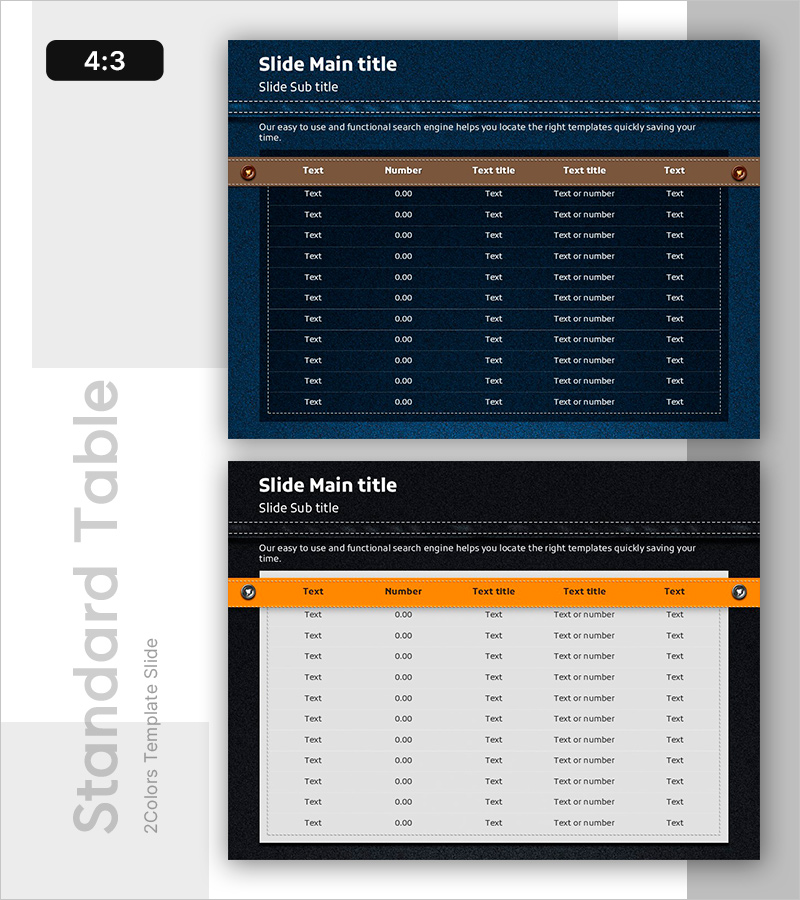
Denim PPT Table Chart – Clearly Presenting Financial Performance
#Financial Plans and Performance #Diagram #Cash Flow Statement
