Market and Competitor Analysis
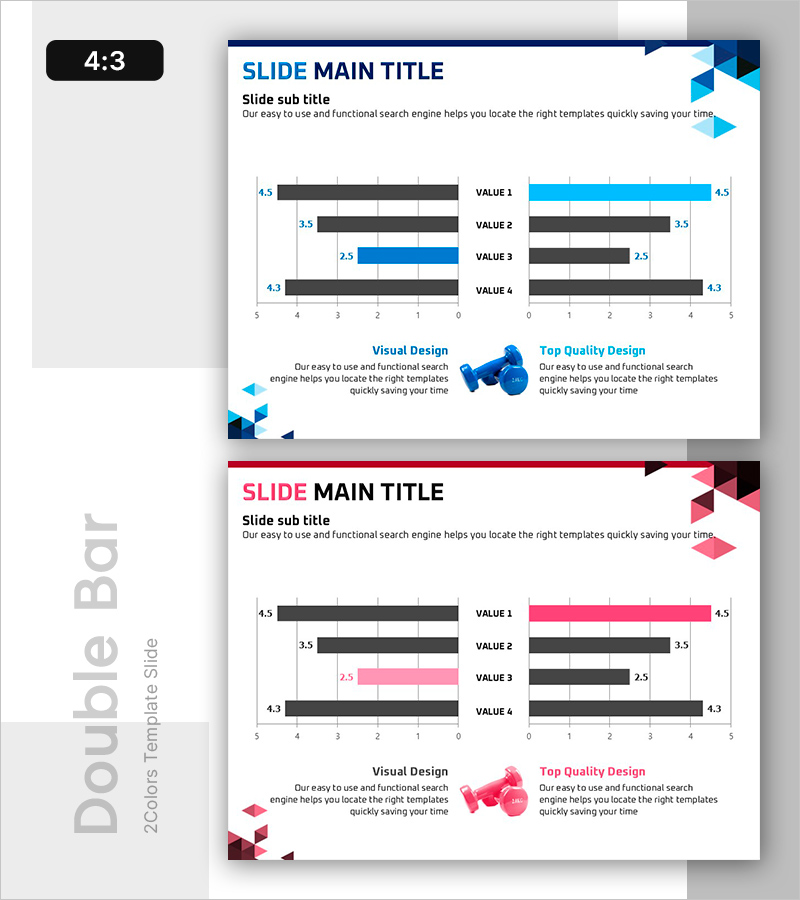
Bar Graph Comparing Exercise Performance by Group
RB0600014_5
- Last Update 12/21/2025
- File Size 0.4MB
- # of Slides 2
- File Format PPTX
- Slide Ratio 4:3
- Color
Keywords
About the Product
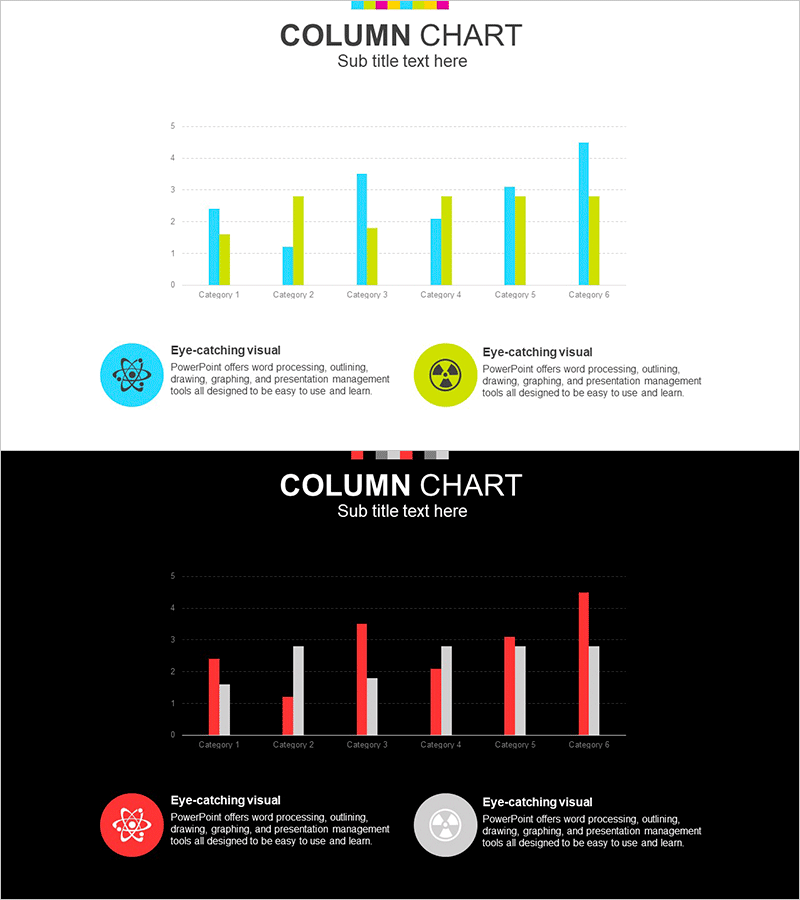
This slide utilizes a horizontal bar graph to effectively compare exercise performance by group, providing clear and impactful data visualization. The contrasting blue and red colors enhance the design, making it ideal for performance analysis reports or workout program evaluations. This template is well-suited for presentations focusing on exercise performance and competitive edge.
Related Products
-
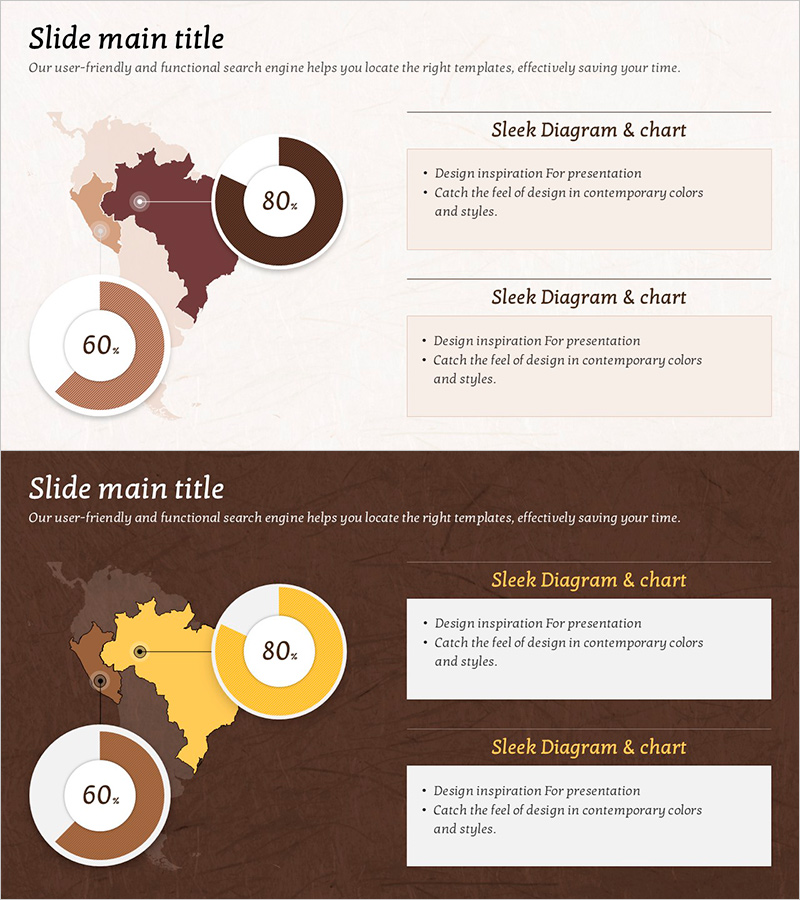
Brown Yellow Regional Analysis – Market Share Visualization
#Market and Competitor Analysis #Graph #Other
-
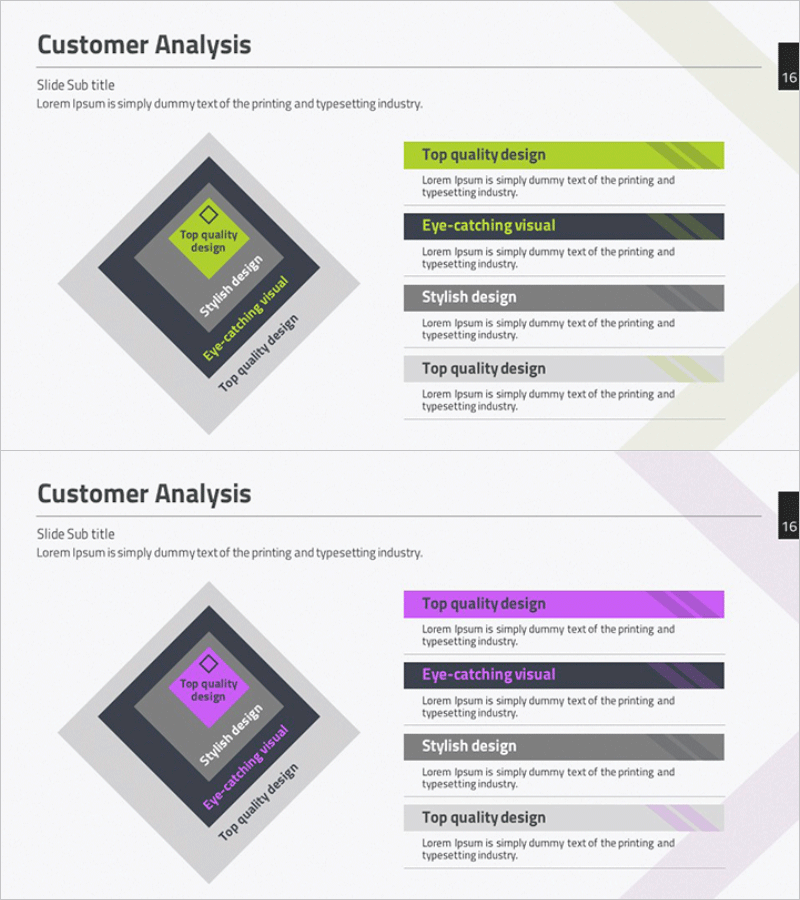
Customer Analysis Inclusion Diagram – Understanding Market and Strategy Development
#Market and Competitor Analysis #Diagram #Customer Analysis
-
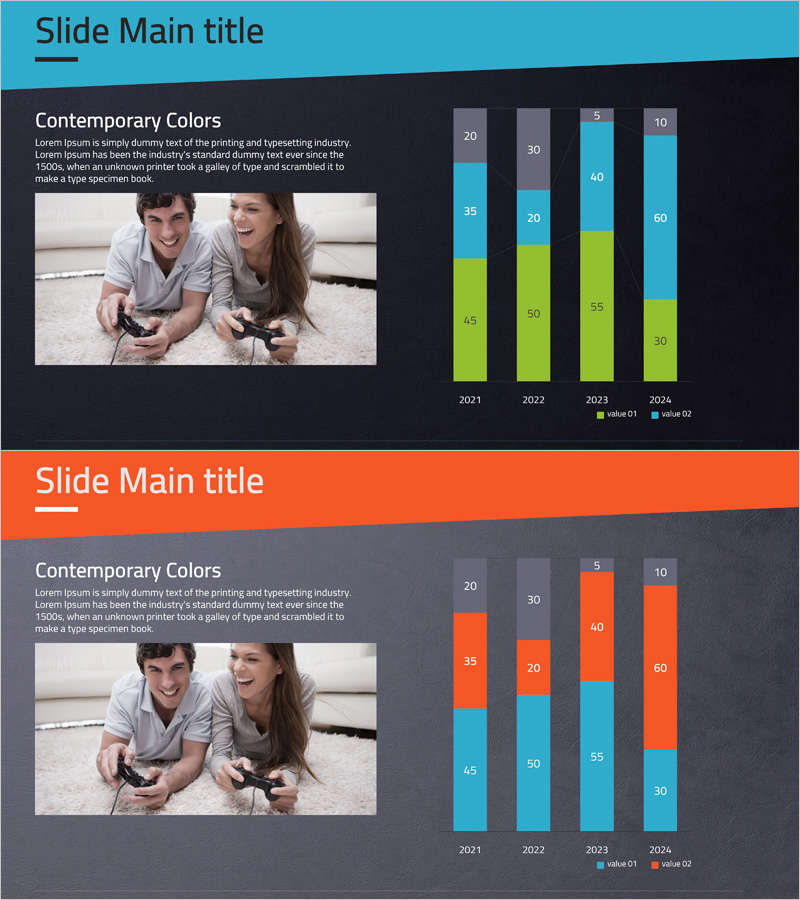
Console Game Analysis Bar Graph – Market and Competitive Analysis
#Market and Competitor Analysis #Graph #Competitor Analysis
-
Chemical Experiment Vertical Bar Graph - Data Visualization and Analysis
#Market and Competitor Analysis #Graph #Competitor Analysis
