Business Vision and Strategy
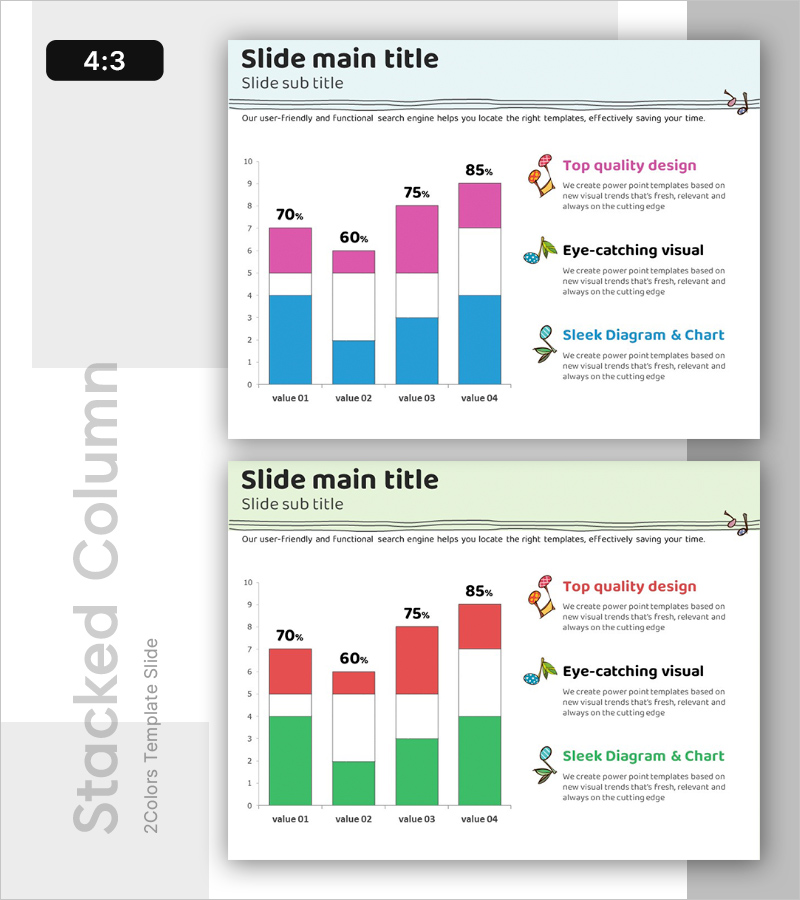
Section Performance Analysis Bar Chart – Competitor Analysis and Market Strategy
RB0300044_4
- Last Update 12/21/2025
- File Size 0.7MB
- # of Slides 2
- File Format PPTX
- Slide Ratio 4:3
- Color
Keywords
- #Content-Based Slides
- #Design-Based Slides
- #Business Vision and Strategy
- #Market and Competitor Analysis
- #Graph
- #Core Competencies
- #Customer Analysis
- #Competitor Analysis
- #Column
- #Segmented Column
- #4:3
- #section performance
- #analysis
- #bar chart
- #competitor analysis
- #market analysis
- #PowerPoint template
- #vertical bar
- #stacked
- #presentation
- #report
About the Product
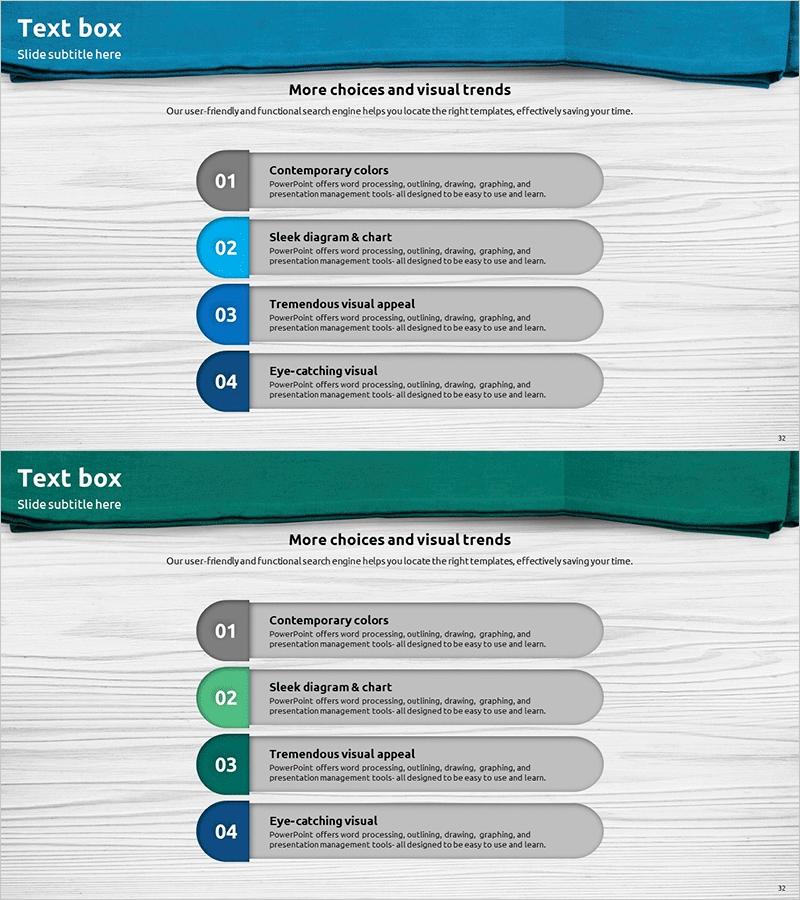
This slide provides a bar chart designed for quantitative analysis of section performance. It visually compares the achievements of different segments, helping to ascertain competitive strengths in the market. The stacked bar chart format simplifies complex data interpretation. Featuring a blue, green, and red color scheme, the visual composition enhances the impact of presentations. This template is particularly useful for creating competitor analysis reports or market analysis documents in corporate settings. With replaceable data areas, the editing process is straightforward, rated as 'easy', making it intuitive for practitioners and teams to utilize.
Related Products
-
Visualizing Construction Field Objectives with Business Diagram
#Business Vision and Strategy #Diagram #Business Goals
-
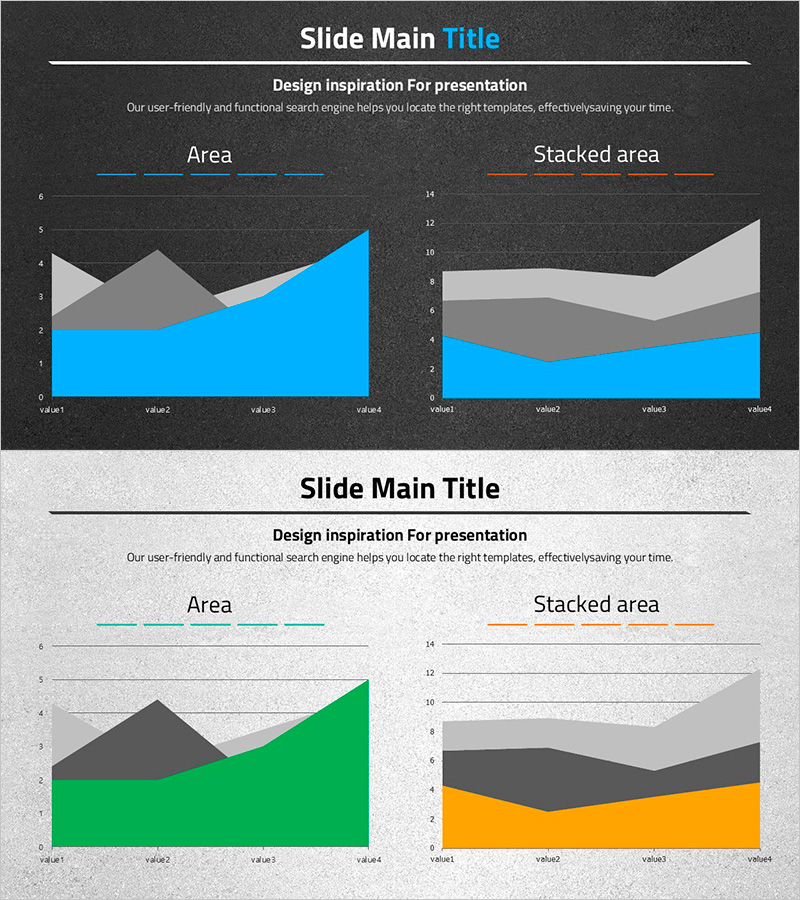
Wide Area Chart for Automotive Market Trend Analysis
#Market and Competitor Analysis #Graph #Competitor Analysis
-
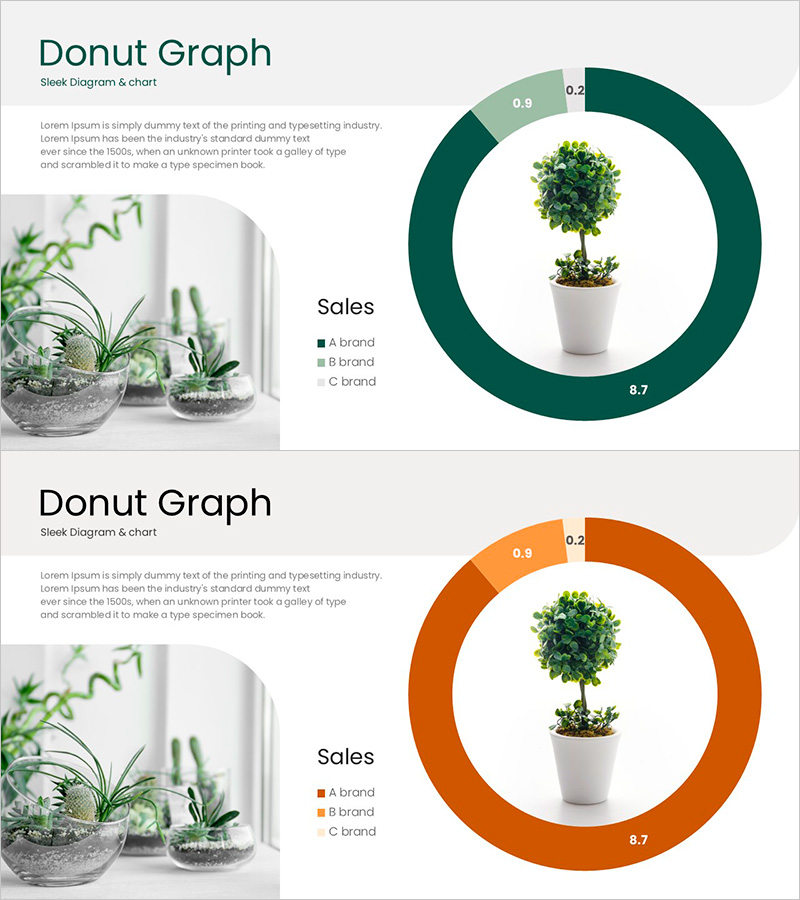
Potted Doughnut Chart for Market Analysis – Performance vs Sales
#Market and Competitor Analysis #Financial Plans and Performance #Graph
-
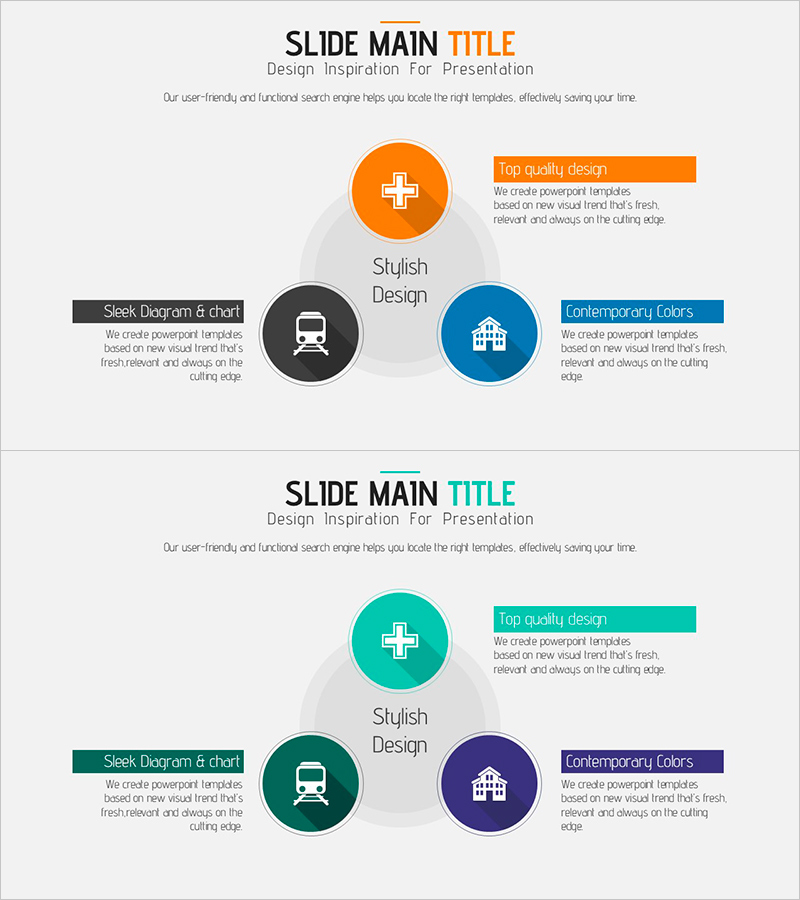
Surgical Drape Theme Goal Diagram – Business Vision and Strategy
#Business Vision and Strategy #Marketing Plan and Strategy #Diagram
