Business Promotion Strategy
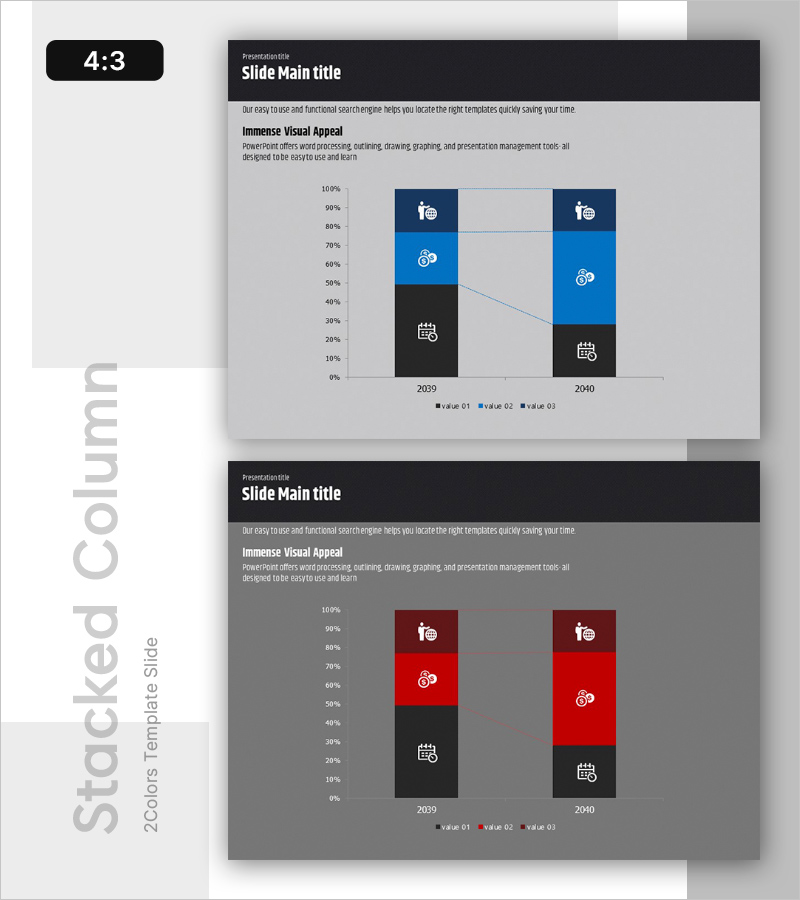
Change Graph by Business Item – Market Trend Analysis
RB0100052_5
- Last Update 12/21/2025
- File Size 0.7MB
- # of Slides 2
- File Format PPTX
- Slide Ratio 4:3
- Color
Keywords
About the Product
This slide uses vertical bar charts to visually represent changes by business item, effectively illustrating market trends. The color combinations enhance clarity, allowing for easy comparison of change trends for each item. It is suitable for 'business strategy' and 'market analysis'. Designed for quick and intuitive understanding during busy schedules, making it applicable for various business meetings and presentations. The editing difficulty is rated 'easy', enabling straightforward replacement of text and data for anyone to use.
Related Products
-
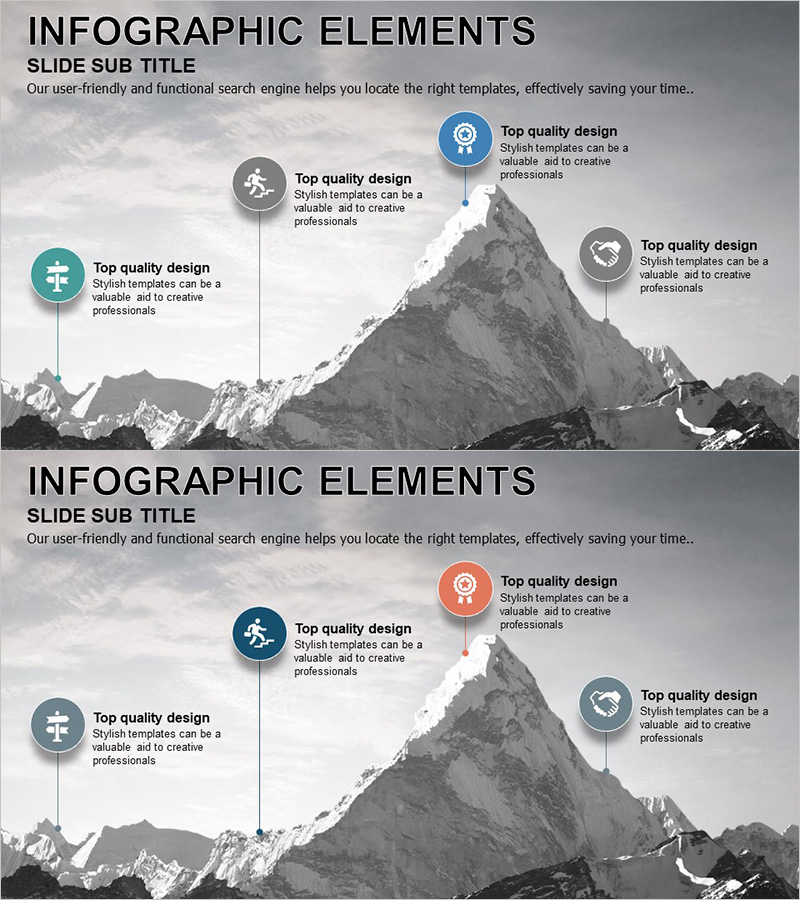
Step-by-step Schedule to Achieve Your Goals Slide – Business Strategy Implementation
#Business Promotion Strategy #Marketing Plan and Strategy #Diagram
-
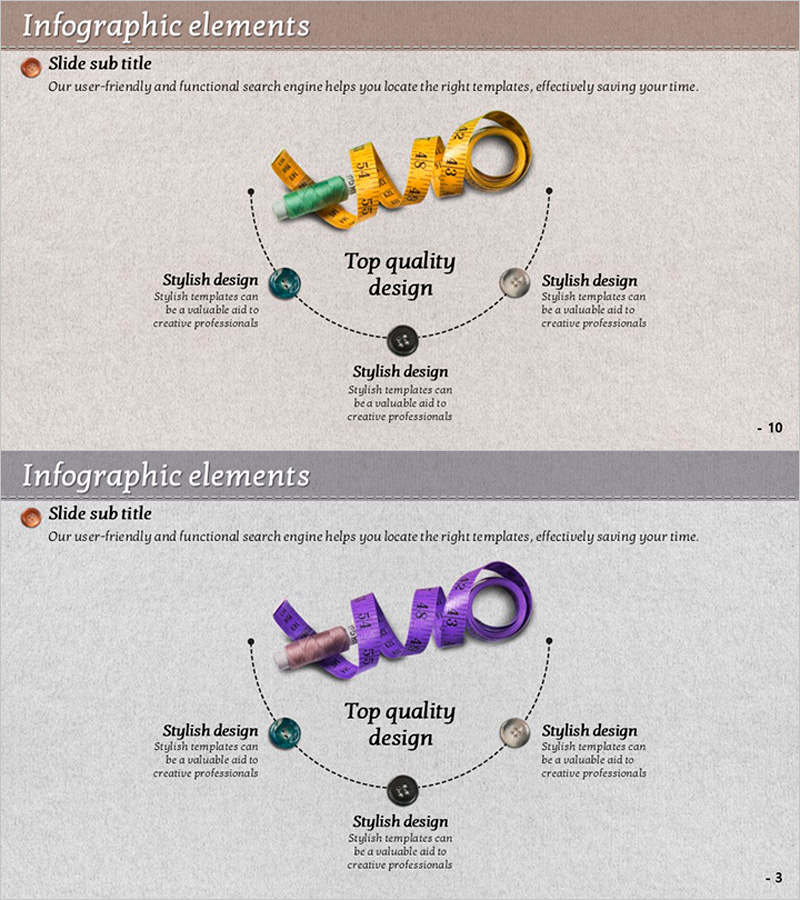
Sewing Tool Diagram – Business Vision and Strategy
#Business Vision and Strategy #Business Promotion Strategy #Diagram
-
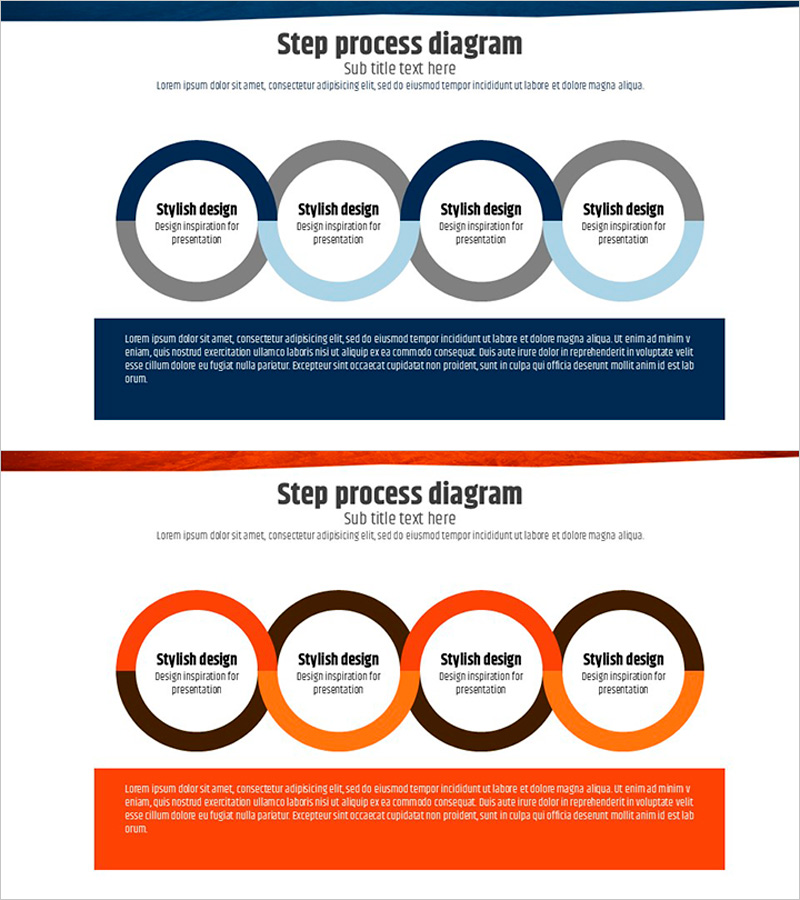
Blue Orange Connection Diagram - Business Strategy
#Business Promotion Strategy #Business Management #Diagram
-
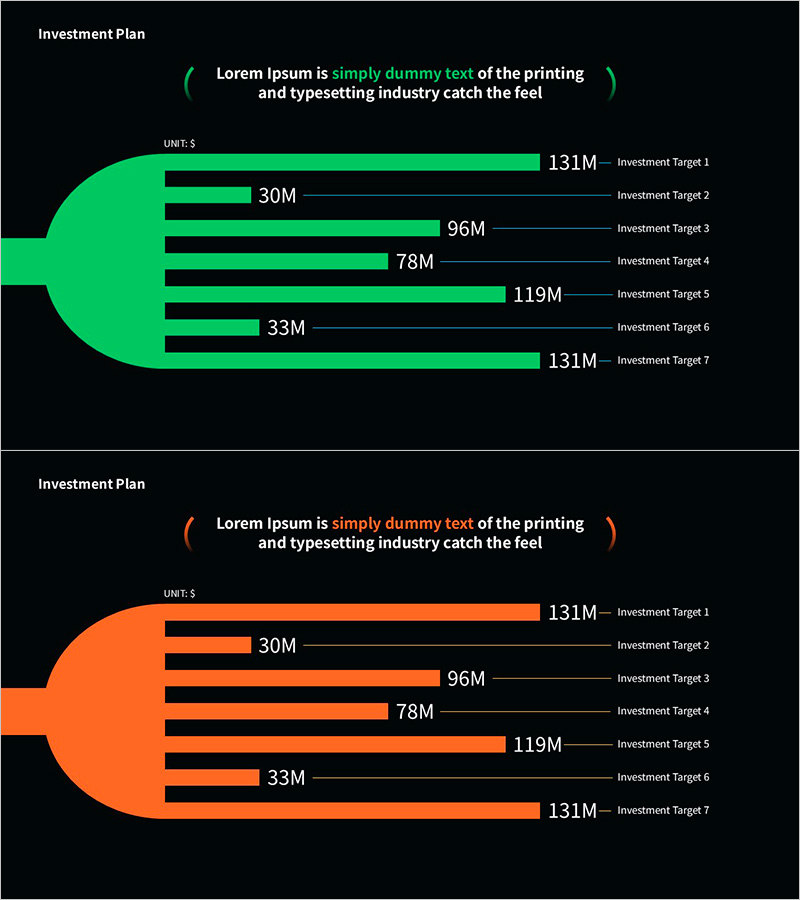
Graph Slide Visualizing Investment Plan
#Financial Plans and Performance #Graph #Capital Requirement Plan
