Sewing Tool Diagram – Business Vision and Strategy
RJ0600059_9
- Last Update 07/06/2025
- File Size 4.9MB
- # of Slides 2
- File Format PPTX
- Slide Ratio 16:9
- Color
Keywords
- #Content-Based Slides
- #Design-Based Slides
- #Business Vision and Strategy
- #Business Strategy
- #Diagram
- #Business Strategy
- #Production Plan
- #Spread
- #Radial Diagram
- #16:9
- #radial diagram PowerPoint
- #expansion diagram slide
- #center message visualization
- #business vision strategy diagram
- #3-direction connection PPT
About the Product
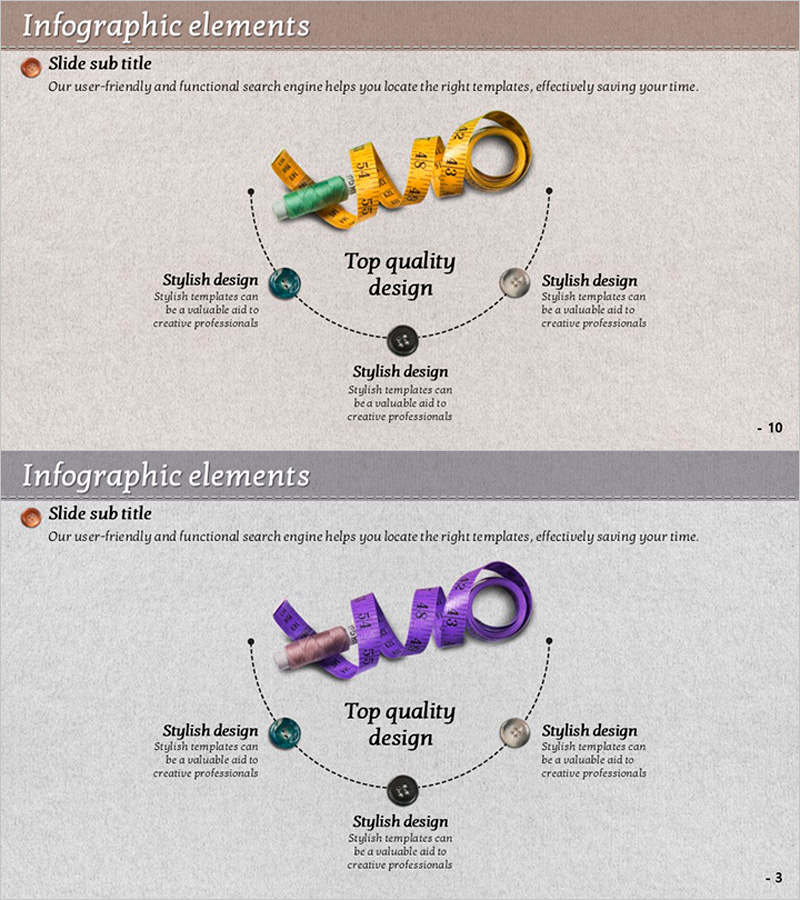
A radial expansion diagram PowerPoint slide featuring a central concept branching into three directional nodes. Using a measuring tool visual metaphor, this presentation slide effectively communicates business vision, strategy, and execution plans through hierarchical representation. Set against a beige background with yellow, green, and gray circular nodes connected by dotted lines, each node accommodates editable text. The 2-slide set is ready for immediate use in various presentation scenarios.
Usage Points
-
Main Usage
Visualizes how an organization's core vision expands into strategy and execution plans across three directions. By simultaneously presenting a central concept and three major directional branches, this diagram effectively supports strategic planning, business proposal presentations, and organizational goal communication.
-
How to Use
Enter your core message (vision, objective, or topic) in the central circular node, then populate the three directional nodes with detailed strategies, execution items, or departmental roles. The dotted line connections clarify hierarchical relationships, and colored nodes are clickable for easy text editing.
-
Recommended For
Ideal for executive reports, business plan presentations, organizational strategy meetings, marketing planning sessions, and new business initiative briefings. Particularly useful for executives, team leaders, and project managers who need to clearly communicate strategic direction.
-
Slide Structure
2-slide composition. Each slide contains one central circular node with three directional circular nodes (4 nodes total) connected by dotted arrows. Node colors—yellow, green, and gray—create visual hierarchy and distinction across the three branches.
Related Products
-

Mosaic Box Diagram – Presenting Business Strategy and Vision
#Business Vision and Strategy #Business Strategy #Diagram
-

3 Business Visions for Travel Guide – Strategies for New Markets
#Business Vision and Strategy #Marketing Plan and Strategy #Diagram
-

Visualizing Business Vision with Rounding Stick Diagram
#Business Vision and Strategy #Business Strategy #Diagram
-

Business Direction Semicircle Diagram – Visualizing Business Strategy
#Business Vision and Strategy #Diagram #Business Strategy
