Business Vision and Strategy
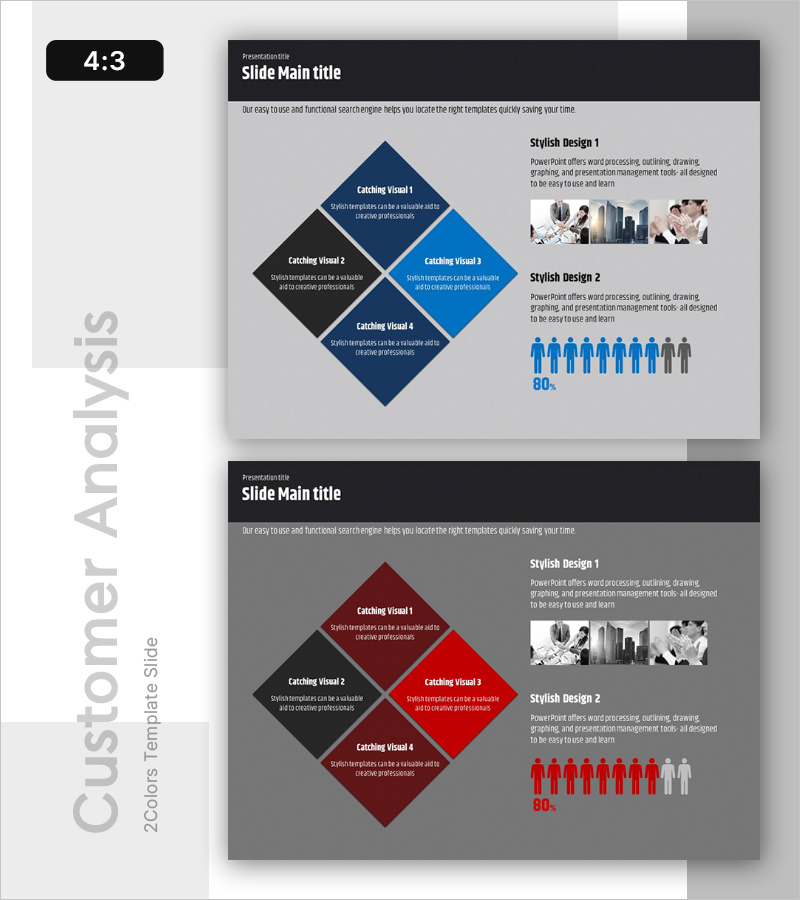
Business Customer Analytics Slide – Strategic Insights
RB0100052_4
- Last Update 12/21/2025
- File Size 0.9MB
- # of Slides 2
- File Format PPTX
- Slide Ratio 4:3
- Color
Keywords
About the Product
This slide utilizes a cluster diagram focusing on business customer analytics to visually present insights into customer behavior in the market. Designed to clearly analyze customer behavior characteristics by integrating various data, its main colors of blue and red create a harmonious and clean layout that effectively conveys key points in presentations. This slide is particularly useful for analyzing specific customer segments or setting business objectives. The text and graph areas are easily replaceable, with an overall editing difficulty rated as 'easy'.
Related Products
-
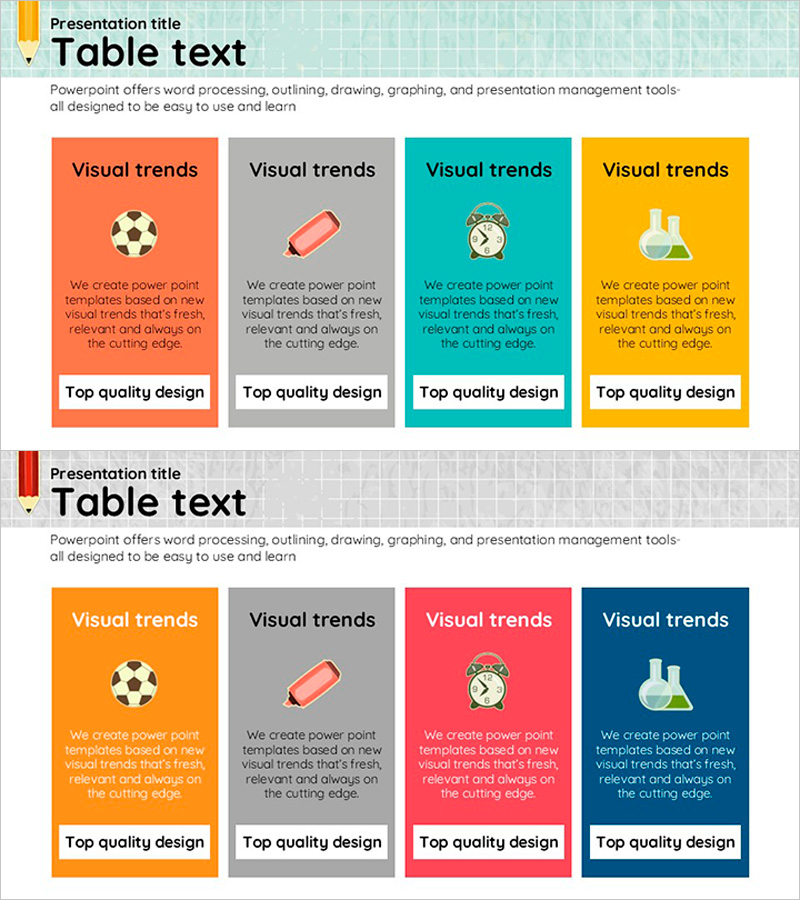
Closed Diagram of Learning Topics – Vision and Strategy
#Business Introduction #Business Vision and Strategy #Diagram
-
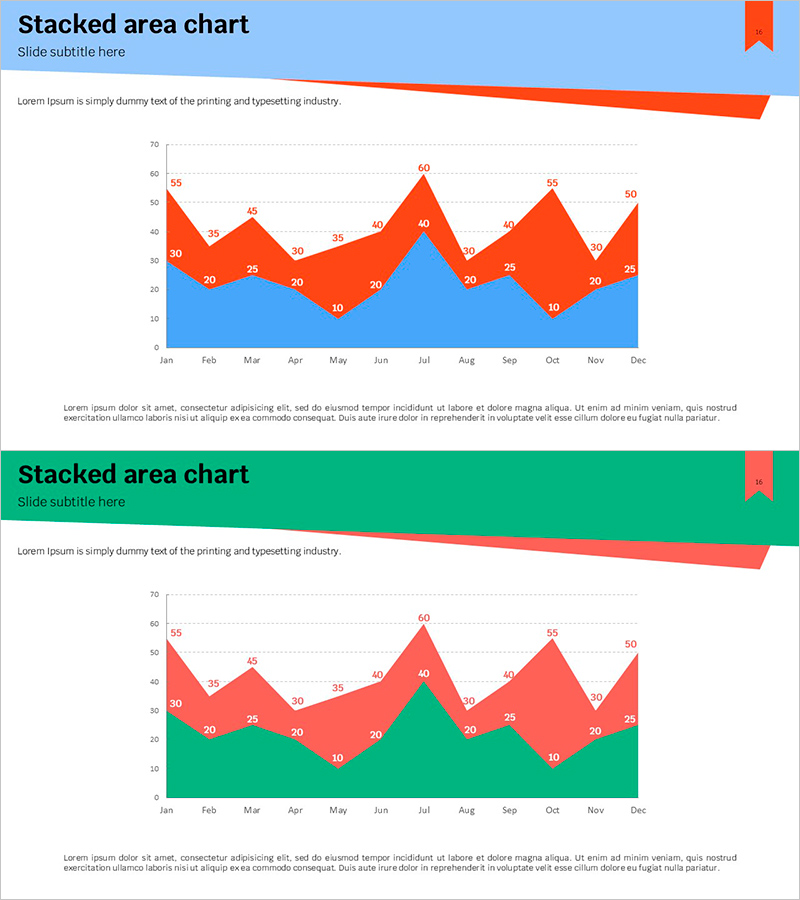
Blue Green Stacked Area Chart – A Powerful Tool for Data Analysis
#Graph
-
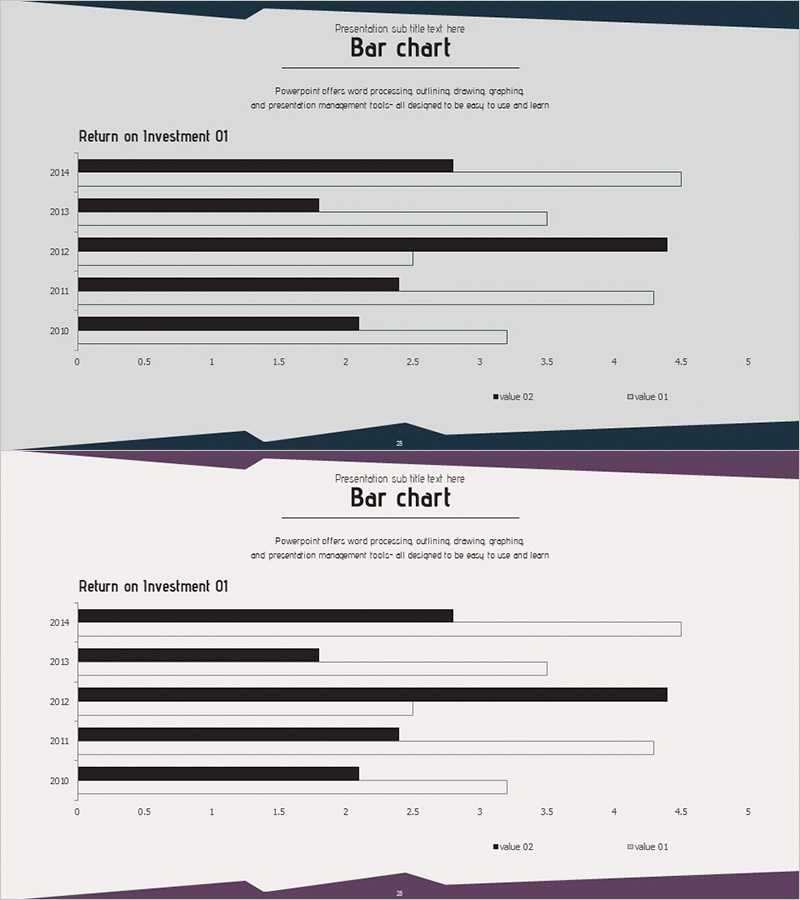
Market Analysis Bar Graph – Effective Data Visualization
#Market and Competitor Analysis #Graph #Market Analysis
-
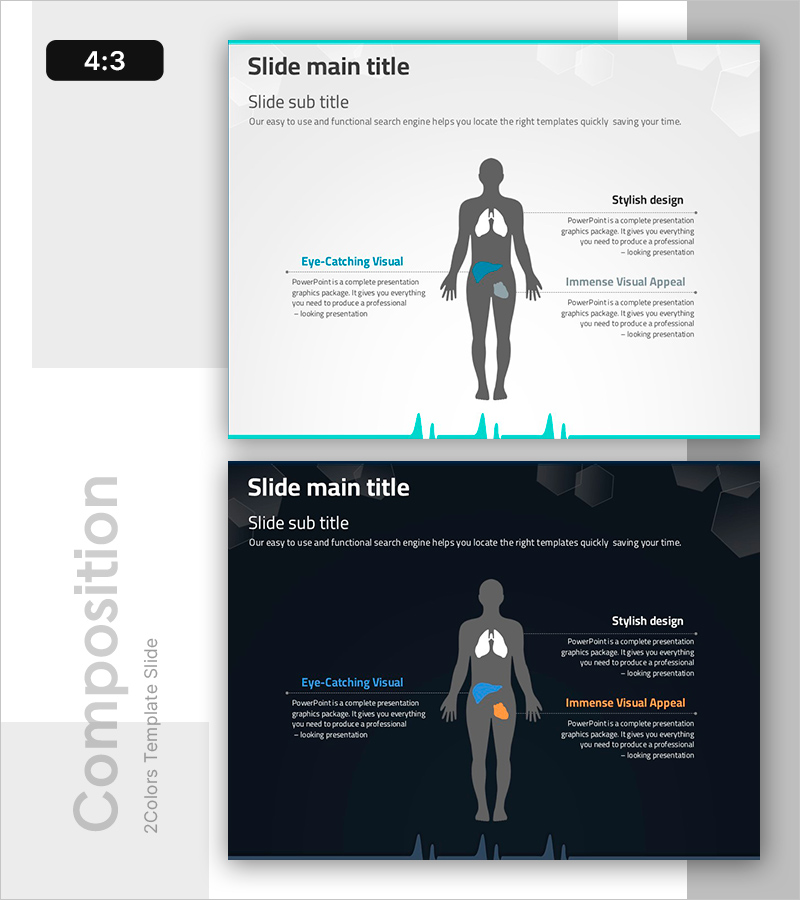
Overview of Major Organs and Their Functions – Visualized Infographic
#Product/Service #Diagram #Other
