Company Introduction
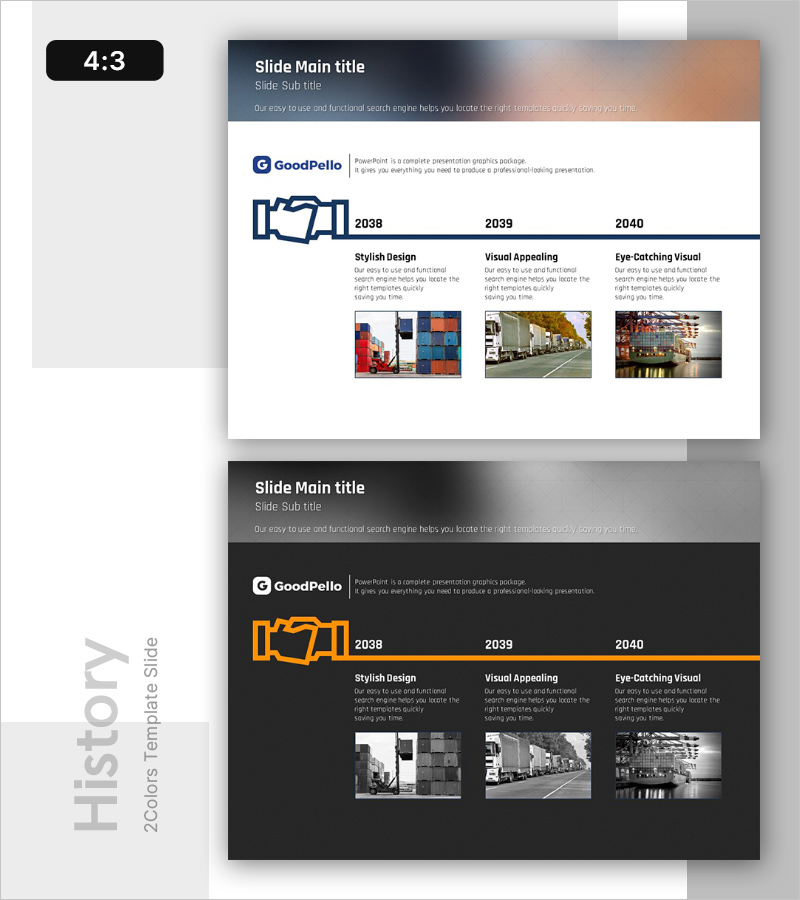
Corporate Growth Timeline Visualized with Pictograms
RB0100035_4
- Last Update 12/21/2025
- File Size 2.1MB
- # of Slides 2
- File Format PPTX
- Slide Ratio 4:3
- Color
Keywords
About the Product
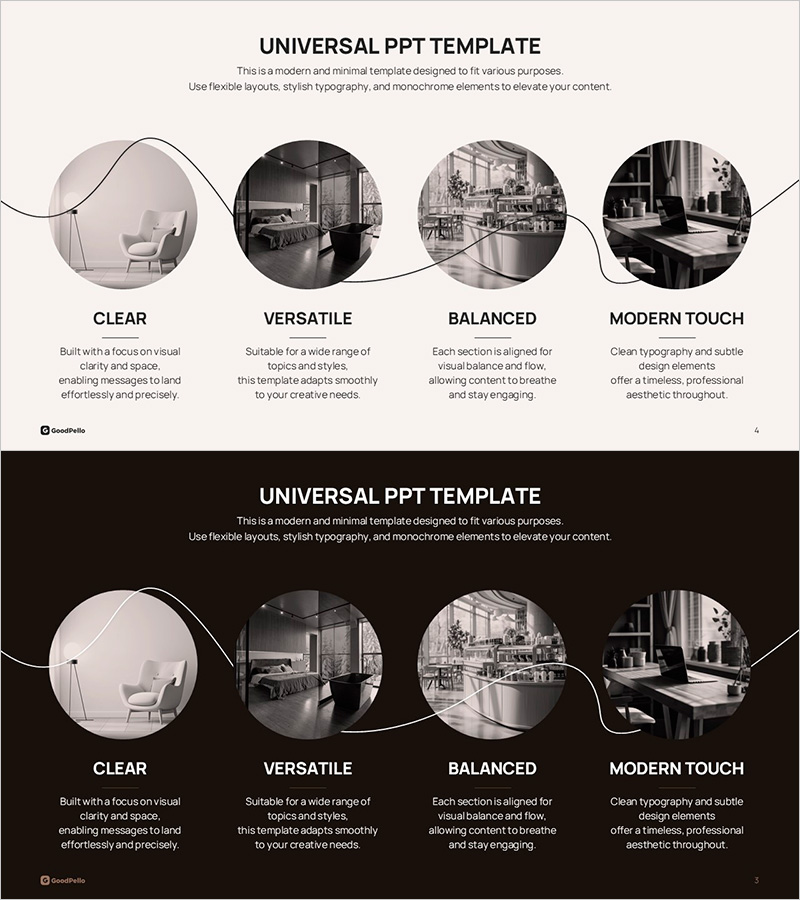
This slide visualizes the corporate growth journey in a timeline format using pictograms. It effectively communicates key achievements for each year, utilizing navy blue and orange colors to convey professionalism and energy. The cluster and connection structure insightfully showcases the stages of corporate development. This slide is ideal for company introductions and historical presentations, providing users with visual understanding.
Related Products
-
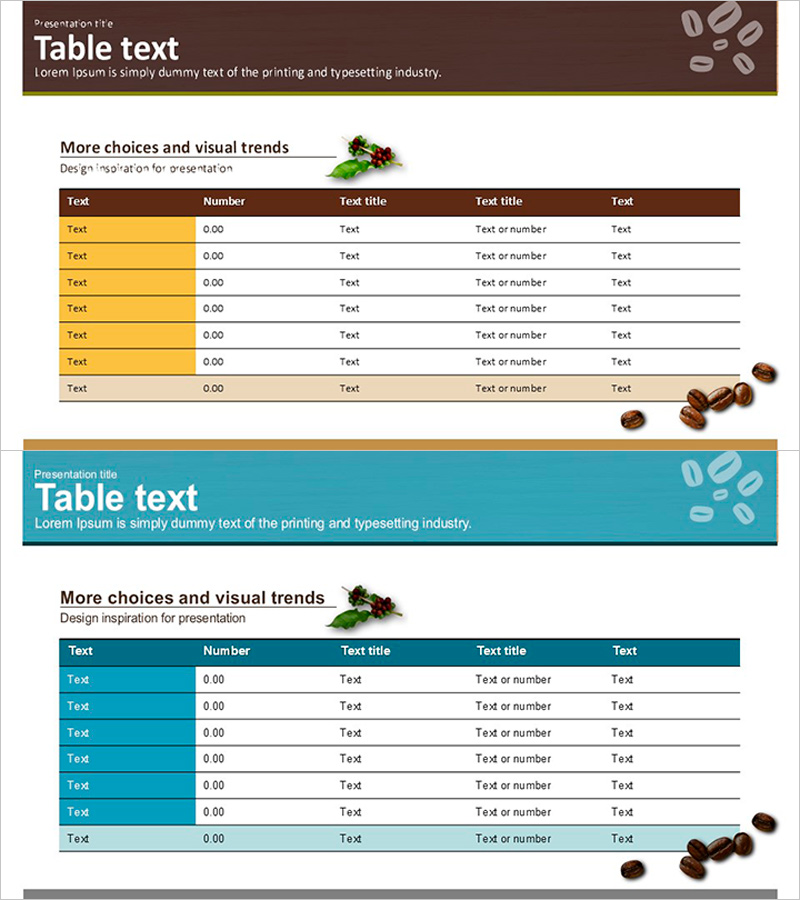
Coffee Bean Template Table – Effective Data Visualization
#Diagram
-
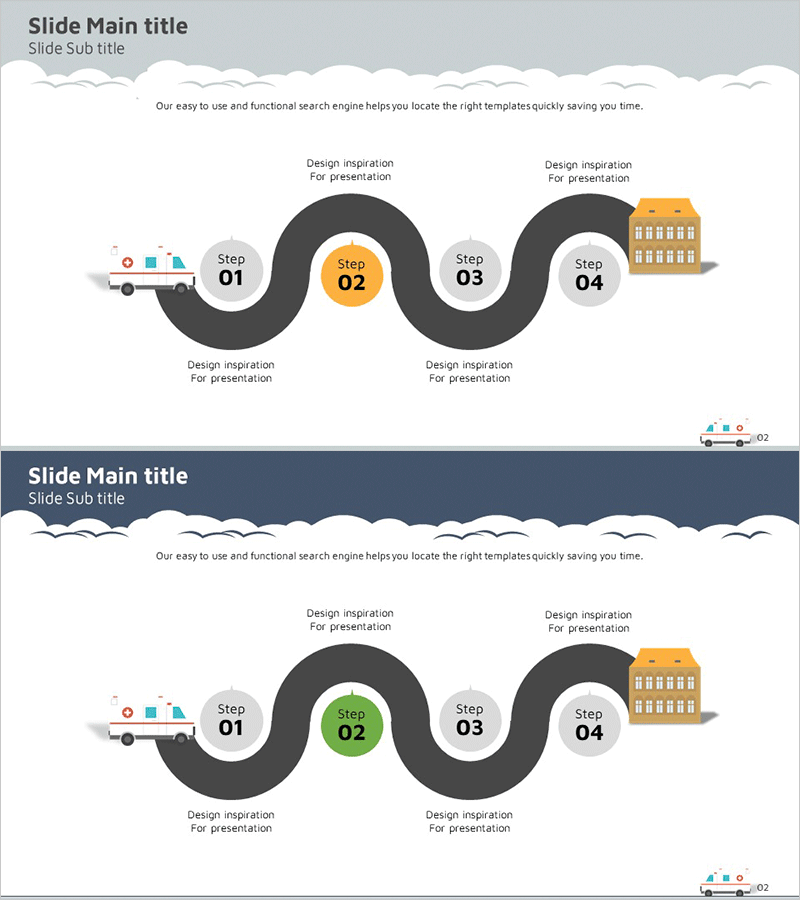
Service Configuration Step-by-Step Schedule Plan – Innovative Approach
#Business Promotion Strategy #Technology Sector #Diagram
-
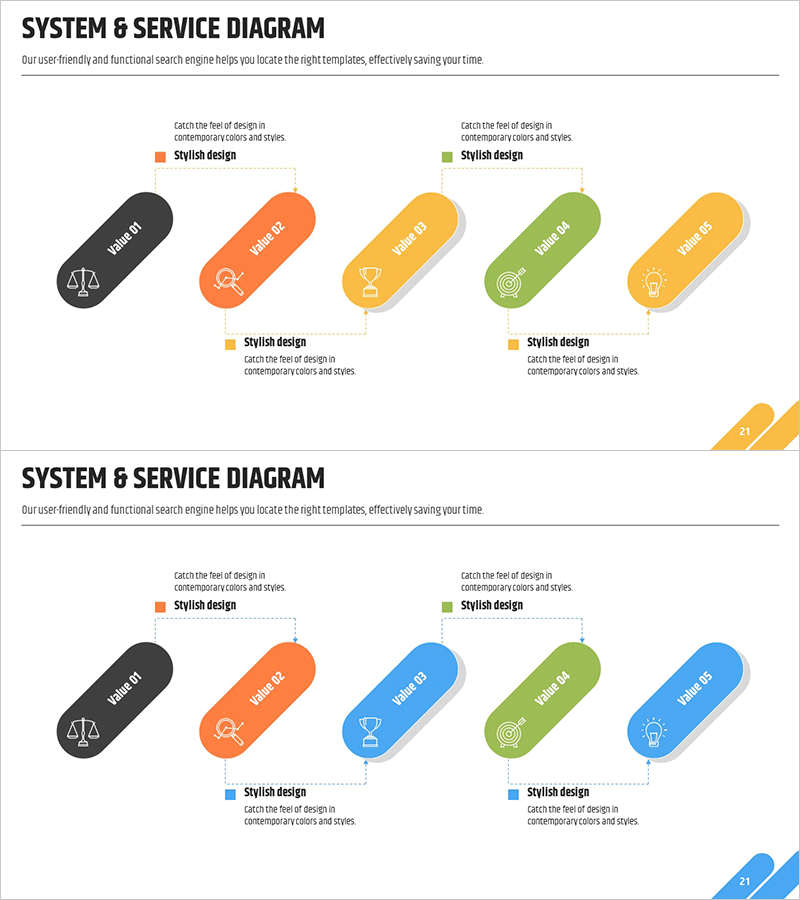
Cluster Connectivity Plan Diagram – Essential Tool for Business Strategy
#Product/Service #Business Promotion Strategy #Diagram
-
Monoflow: The Allure of Connection through 4 Characteristics
#Product/Service #Diagram #Product/Service Introduction
