Business Vision and Strategy
Financial Market Needs Analysis – Business Strategy with Visual Data Focus
RM0800006_5
- Last Update 12/21/2025
- File Size 2.5MB
- # of Slides 2
- File Format PPTX
- Slide Ratio 16:9
- Color
Keywords
About the Product
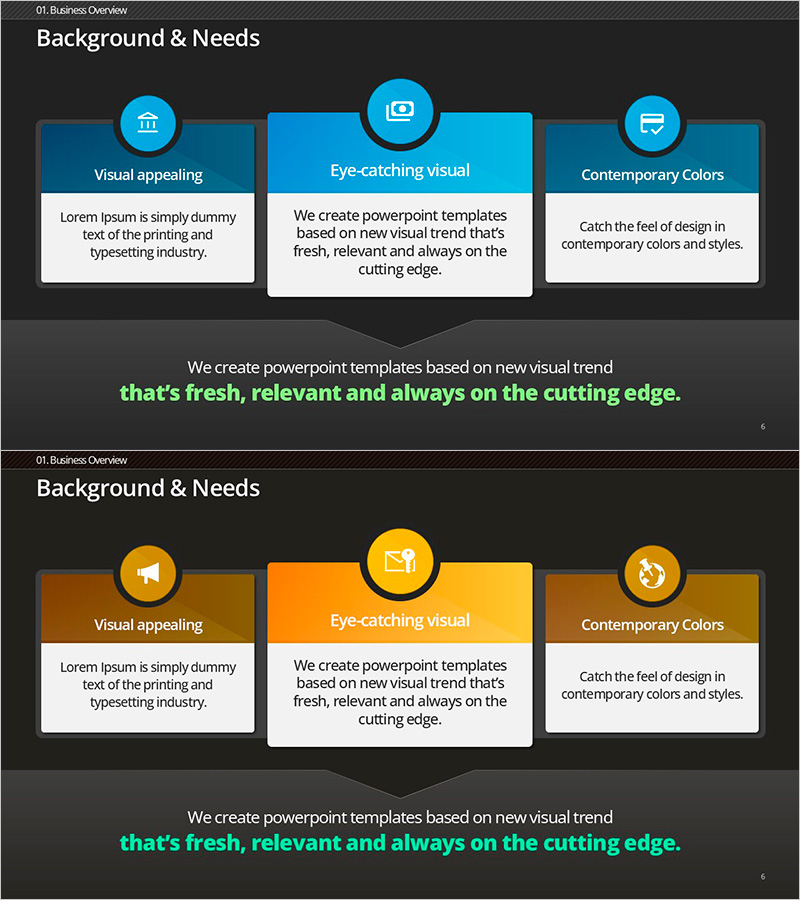
This slide visualizes various demands within the financial market effectively using diagrams. With a modern design and a harmonious color palette of blue, yellow, and brown, it clearly conveys information, making it suitable for business analysis materials. The visually appealing layout emphasizes critical elements in reports and provides essential background information for market and competitor analysis. This slide is designed for easy replacement of various data and text, with an editing difficulty rating of 'easy', allowing for quick implementation in practical settings.
Related Products
-
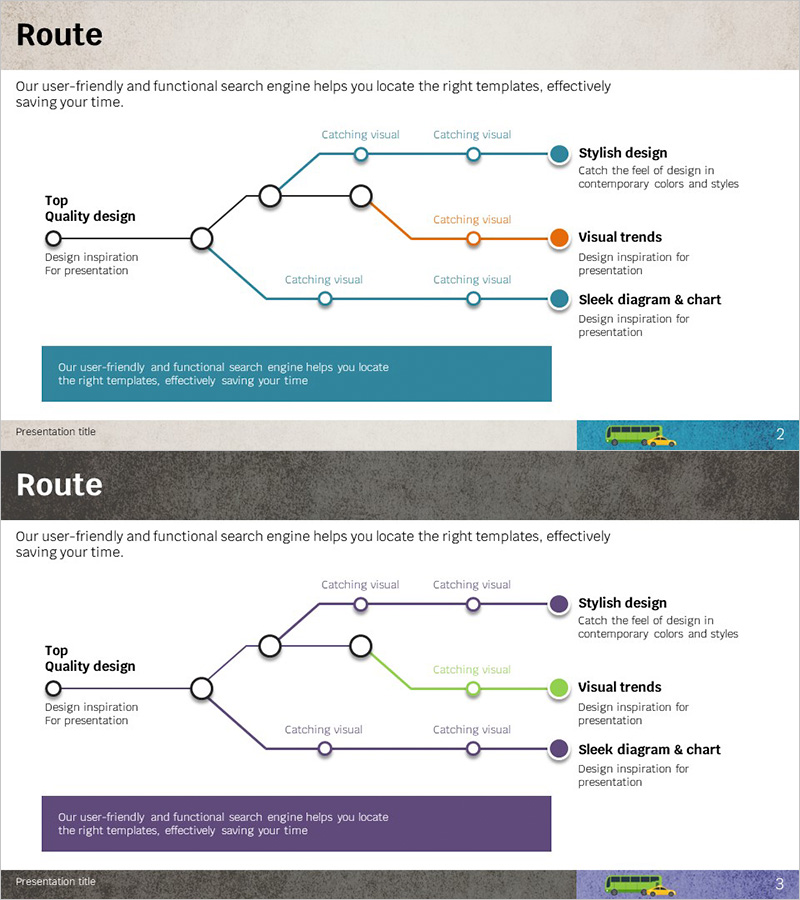
Subway Route Map Shape Diagram – Organizational Structure and Visualization
#Company Introduction #Diagram #Organizational Chart
-
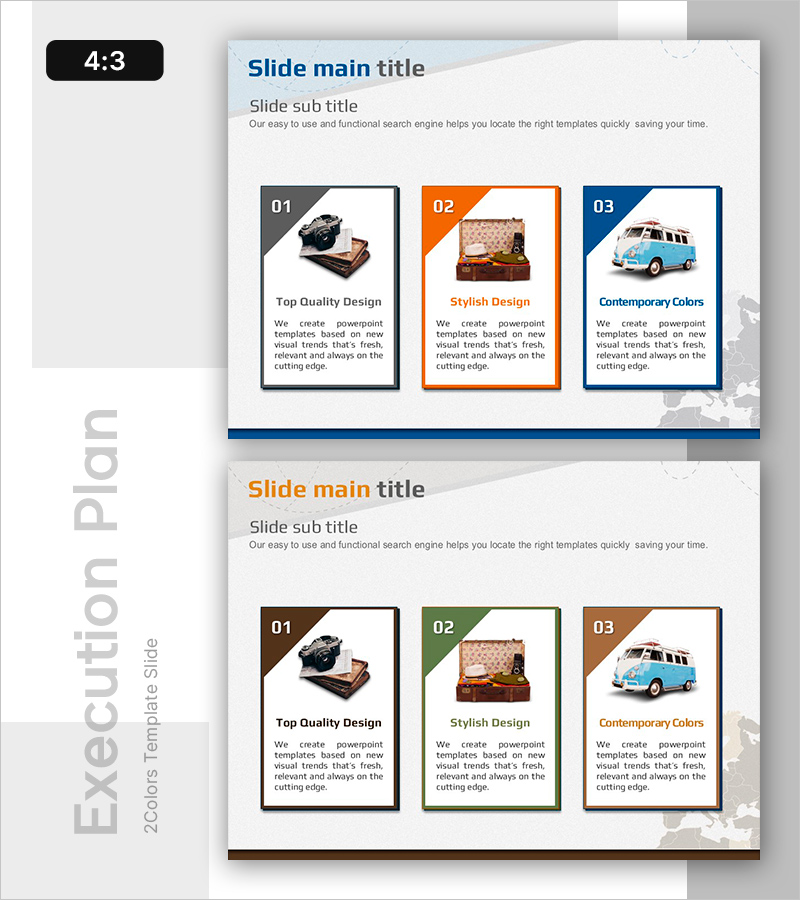
Travel Preparations and Travel Plan Slide – Cluster Diagram
#Product/Service #Business Management #Diagram
-
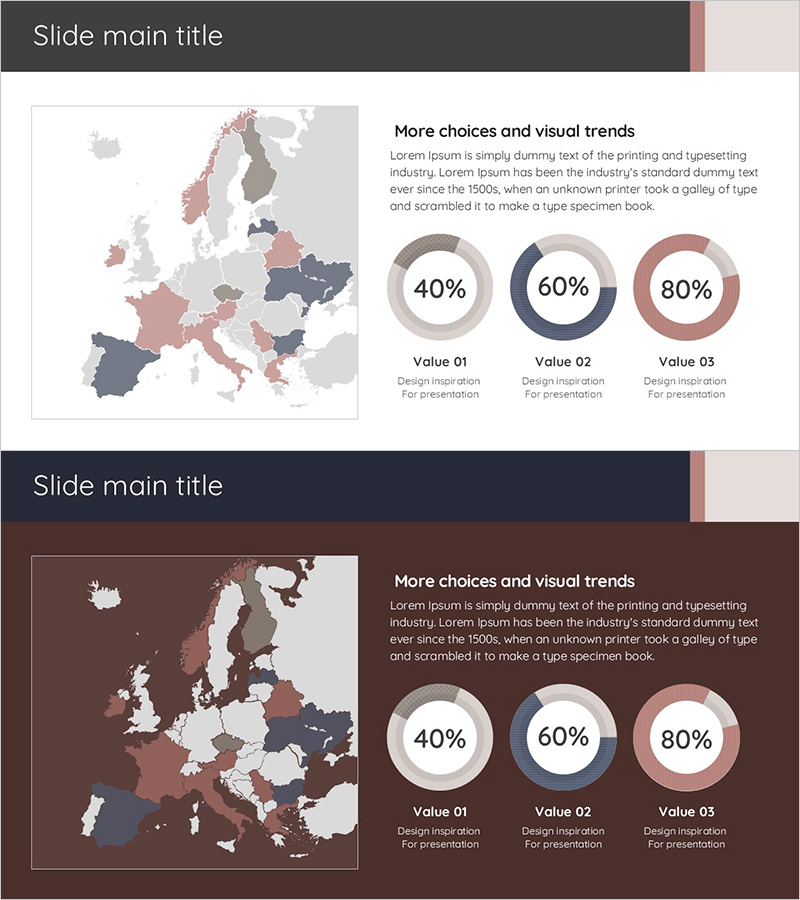
Graph of Sales by Region – Visualizing Market Status
#Market and Competitor Analysis #Graph #Other
-
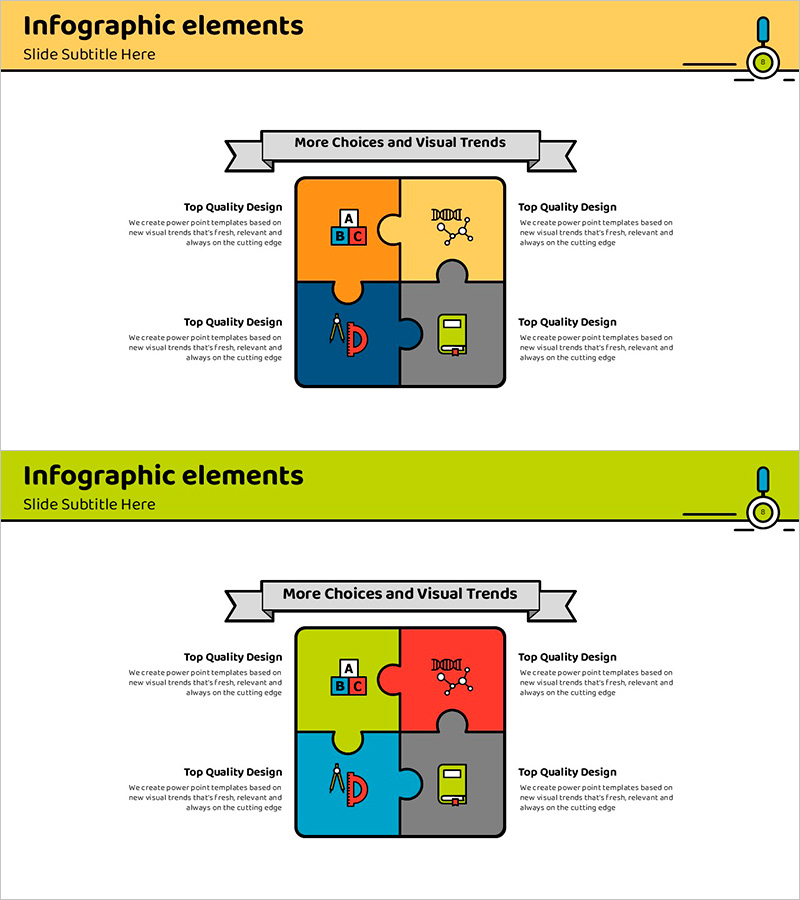
Educational Puzzle Connected Diagram – Program Introduction and Service Overview
#Product/Service #Diagram #Program Introduction
