Financial Plans and Performance
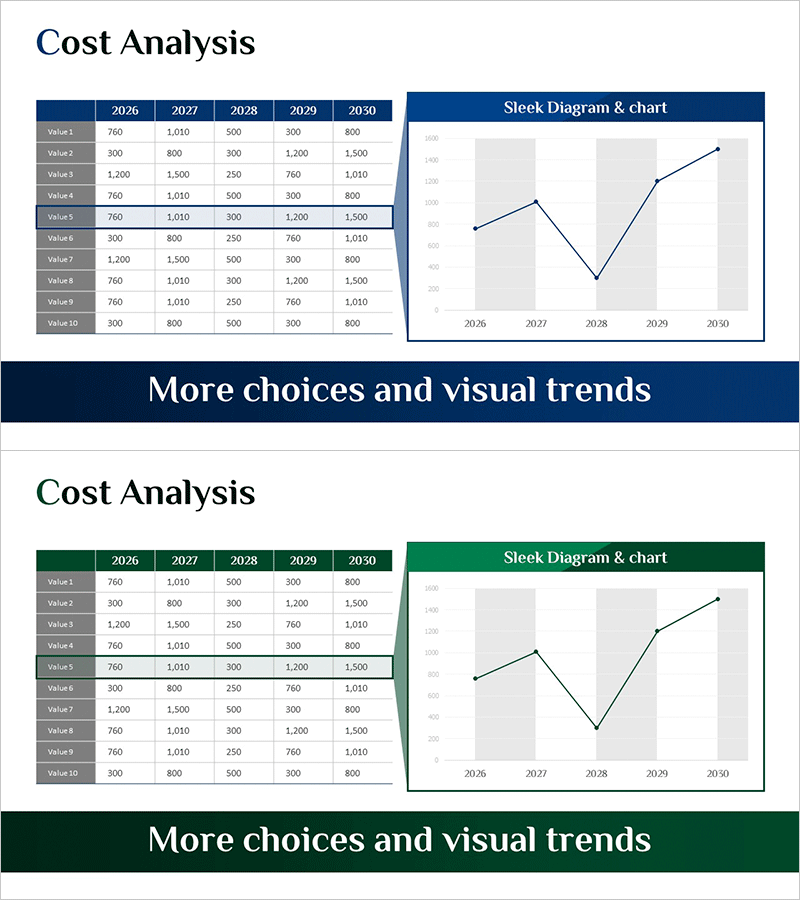
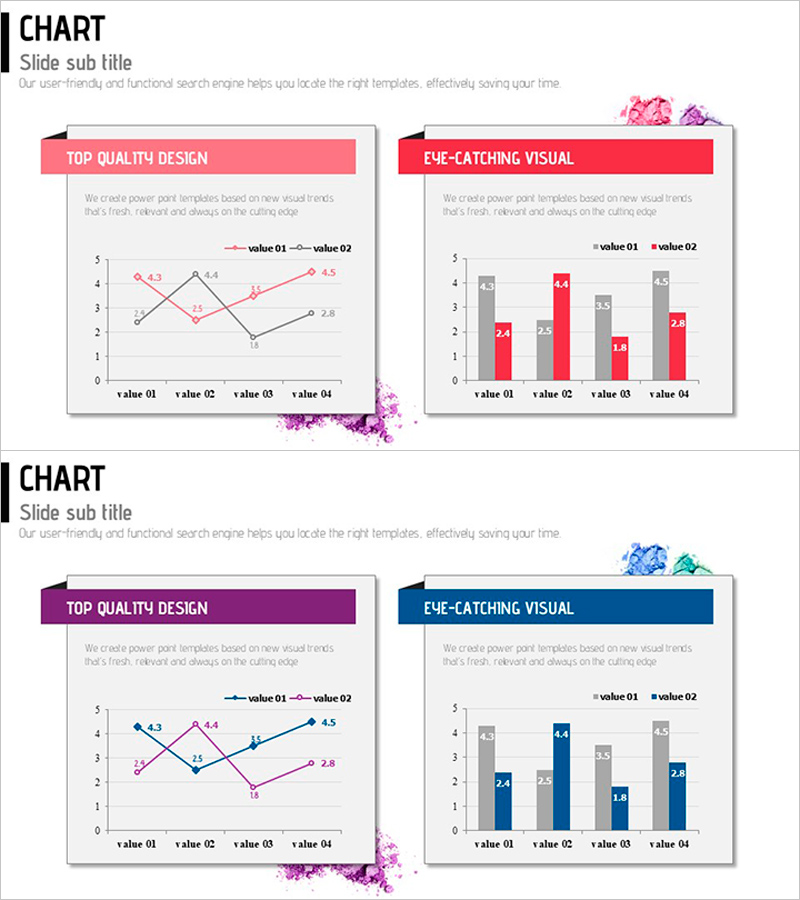
Production Cost Variance Analysis Chart – Visualizing Financial Performance
RM0600006_15
- Last Update 12/21/2025
- File Size 0.9MB
- # of Slides 2
- File Format PPTX
- Slide Ratio 16:9
- Color
Keywords
About the Product
This slide features a chart designed for production cost variance analysis, making data interpretation easy. The clear structure of tables and graphs effectively conveys statistical information, providing reliability and stability with a blue and green color scheme. It is ideal for financial performance analysis and budget planning, suited for quantitative business presentation materials. The ease of replacing figures and graphs results in an 'easy' editing difficulty, allowing for quick use in various environments.
Related Products
-
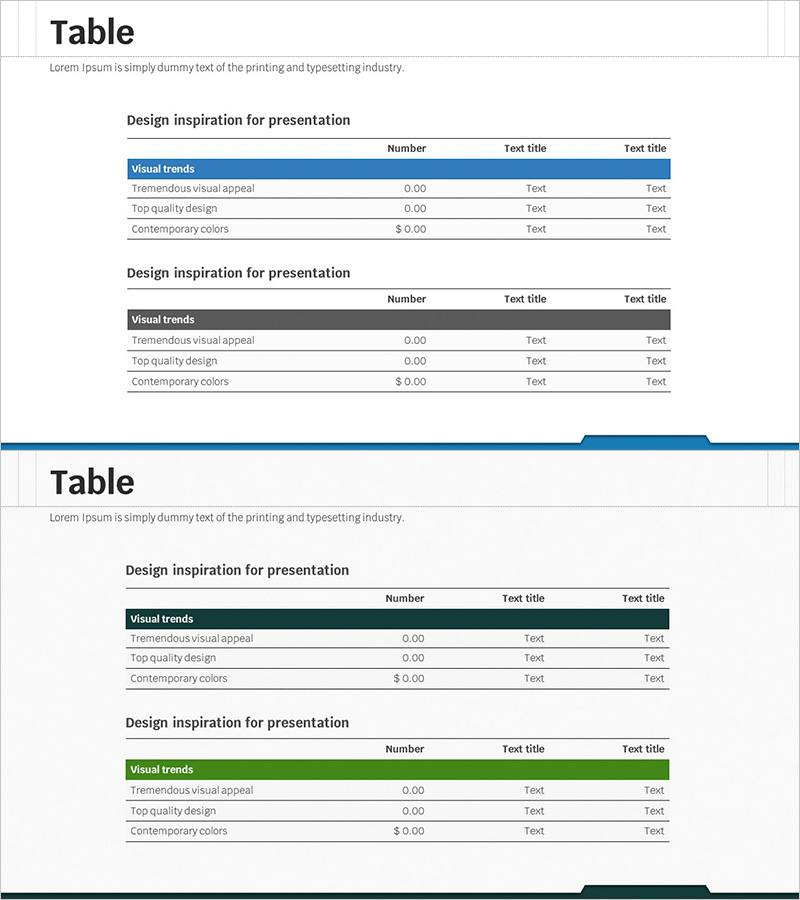
Key Financial Indicators Table – Clear Profit Analysis
#Financial Plans and Performance #Diagram #Income Statement
-
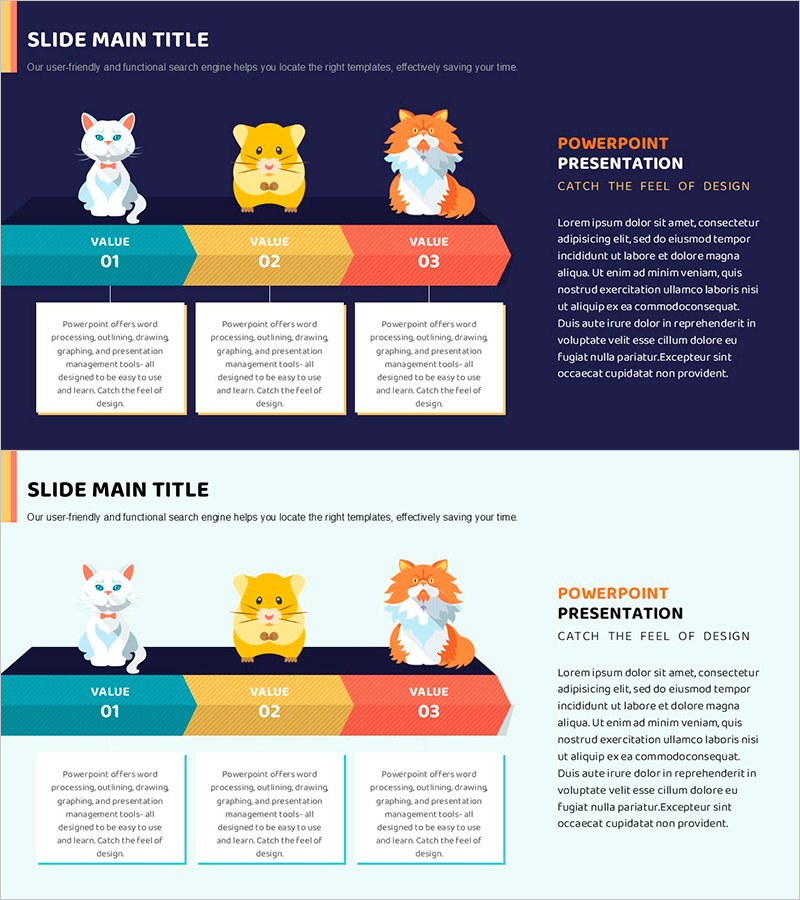
Companion Flow Diagram – Visualizing Business Strategy
#Business Promotion Strategy #Diagram #Phase-wise Schedule Plan
-
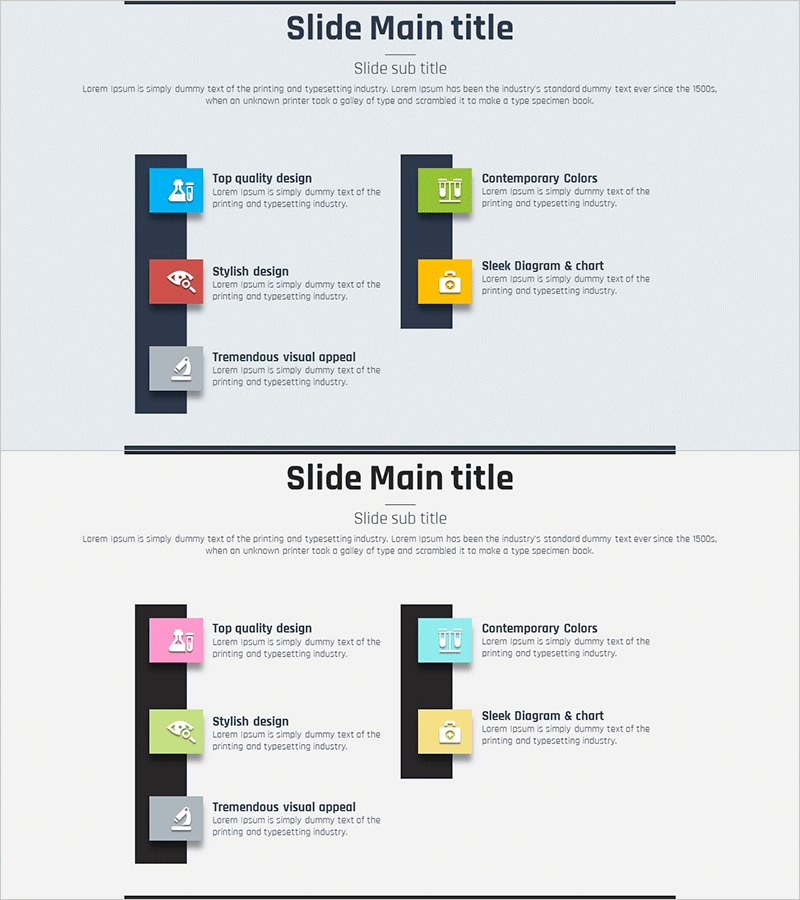
Medical Business Sector Closure Diagram
#Company Introduction #Diagram #Business Areas
-
Market Insights Through Competition Analysis Chart – Gaining Competitive Edge
#Market and Competitor Analysis #Graph #Competitor Analysis
