Market and Competitor Analysis
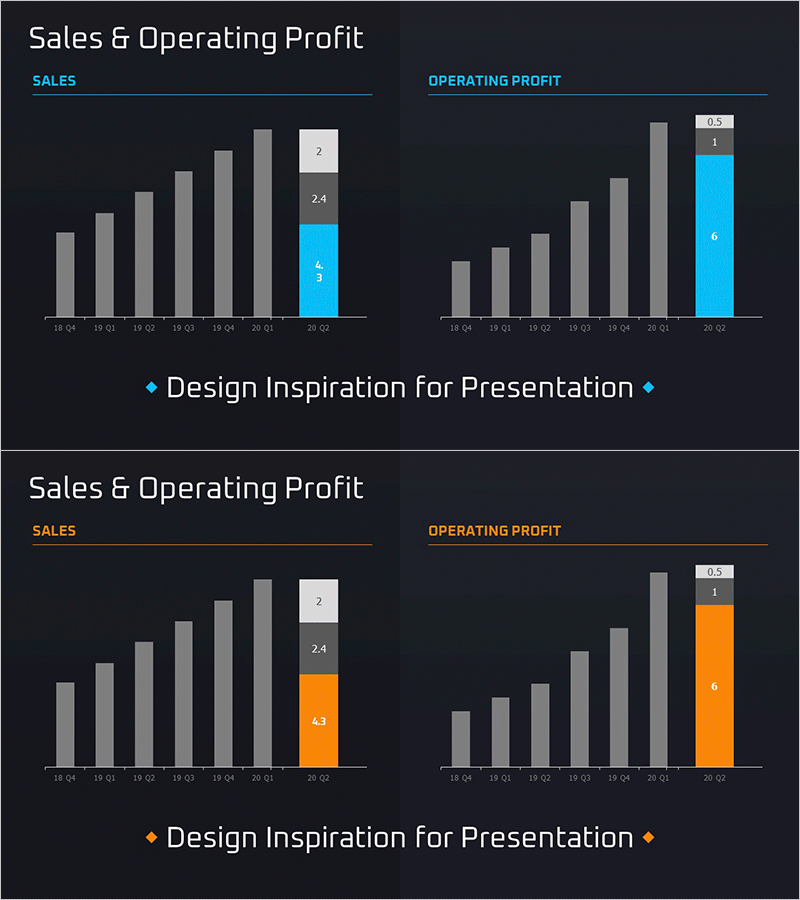
Sales and Profit Calculation Graph – Financial Performance at a Glance
RM0600004_12
- Last Update 12/21/2025
- File Size 0.3MB
- # of Slides 2
- File Format PPTX
- Slide Ratio 16:9
- Color
Keywords
About the Product
This slide effectively compares sales and operating profit using horizontal and vertical bar graphs. The segmented graph structure provides clear data visualization. The main colors of blue and orange create a visually identifiable distinction among text and graph areas. Ideal for financial performance, market and competitor analysis presentations to stakeholders or management, this design includes effective elements for investor pitches. The text and figures are easily interchangeable, with an overall editing difficulty of 'easy', making it suitable for diverse presentations.
Related Products
-
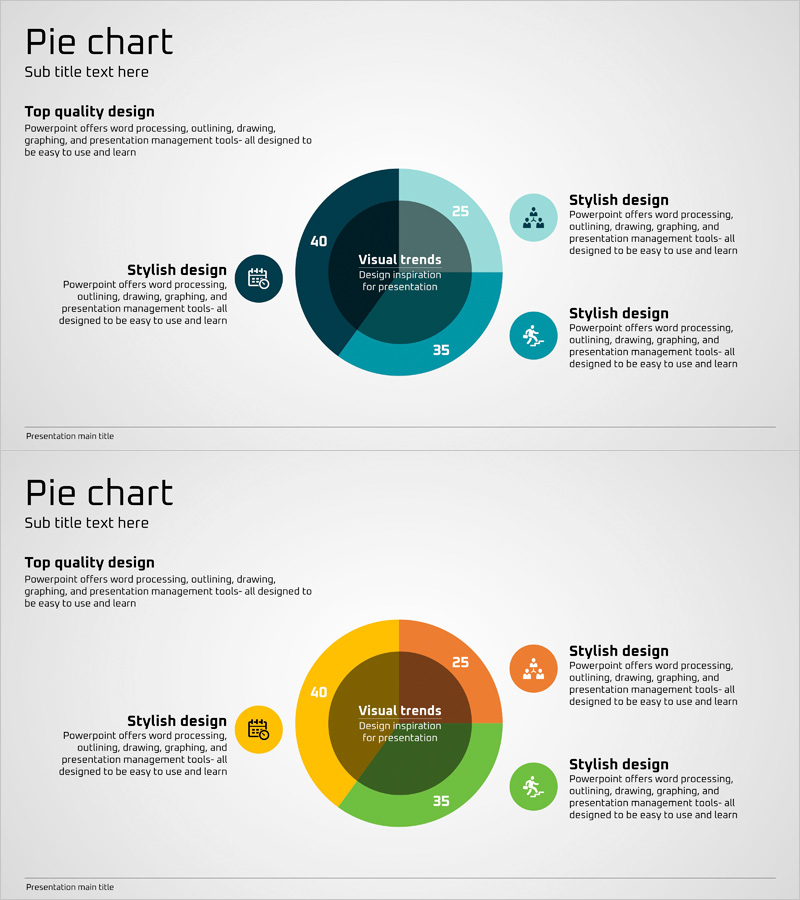
Market Share and Analysis Graph – Blue, Orange, Green
#Market and Competitor Analysis #Graph #Market Share
-
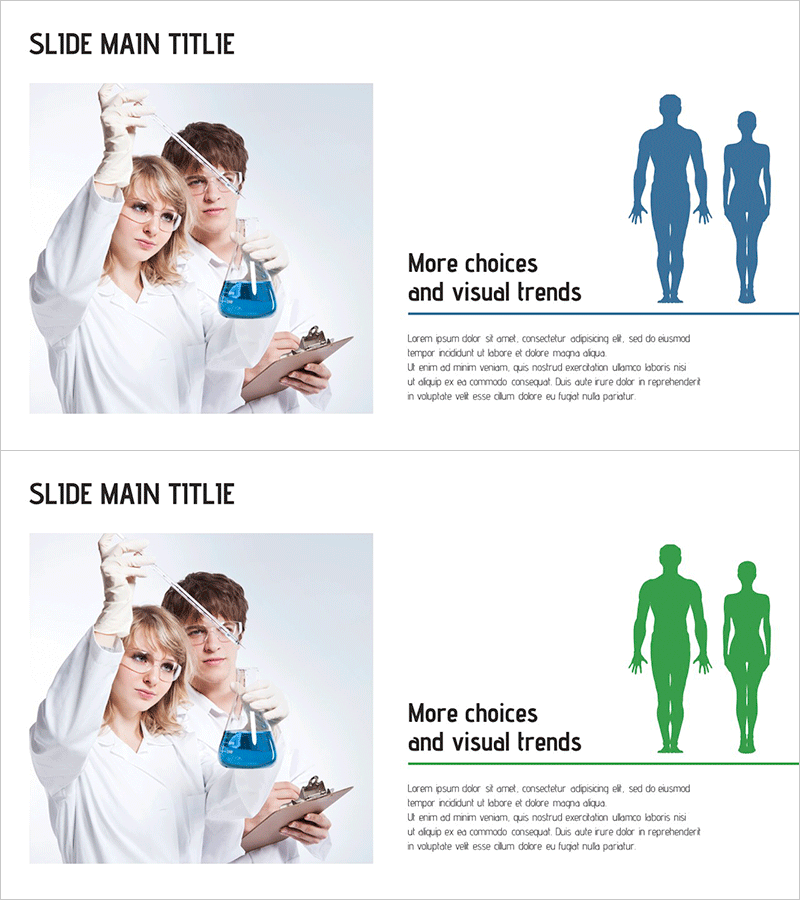
Presentation Slide for Scientific Experiment – Choices and Visual Trends
#Market and Competitor Analysis #Other #Customer Analysis
-
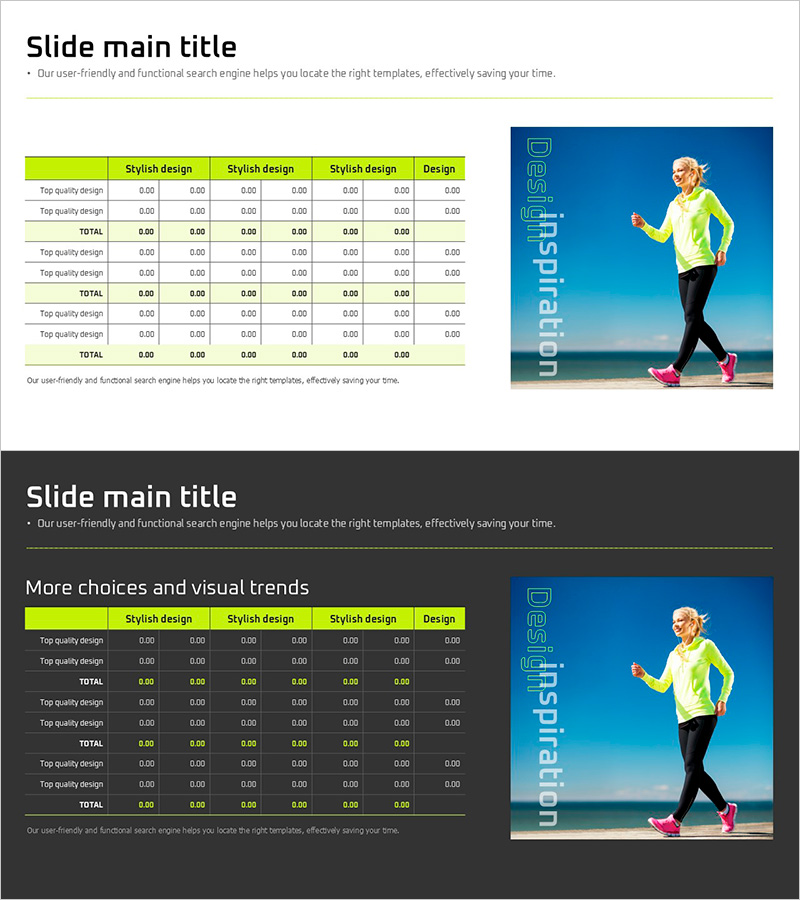
Slide Template for Sports Data Analysis – Understanding Market Trends and Information
#Market and Competitor Analysis #Financial Plans and Performance #Diagram
-
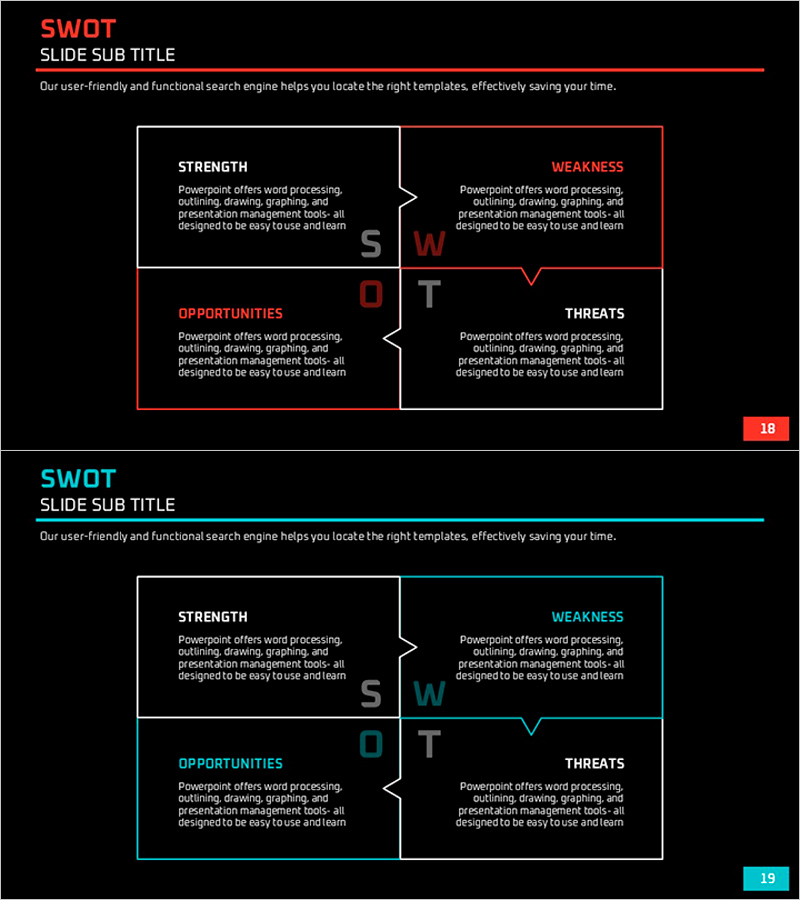
Red Sky SWOT Analysis Slide
#Market and Competitor Analysis #Diagram #SWOT Analysis
