Financial Plans and Performance
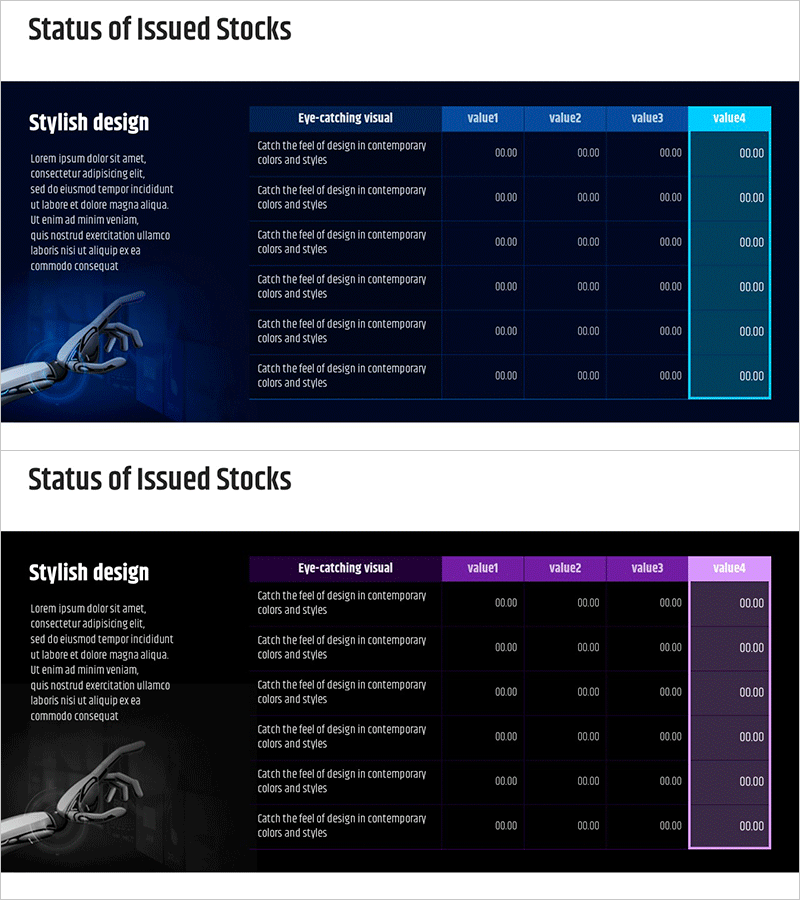
Stock Issuance Status Analysis Chart – Financial Planning and Performance
RM0600003_7
- Last Update 12/21/2025
- File Size 0.3MB
- # of Slides 2
- File Format PPTX
- Slide Ratio 16:9
- Color
Keywords
About the Product
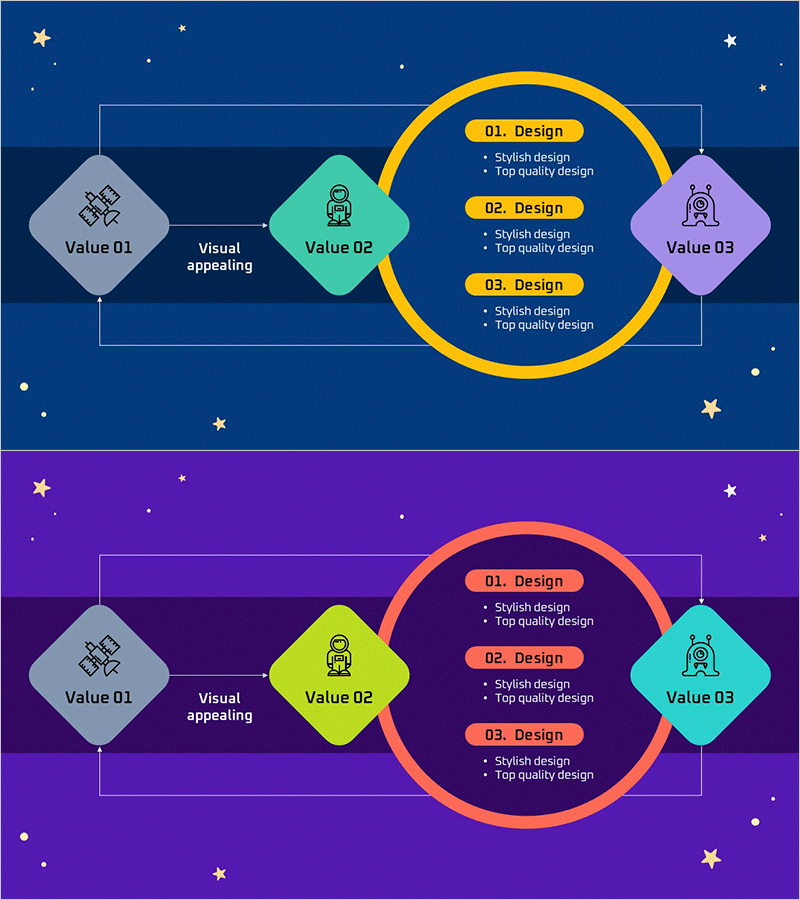
This slide features a chart for analyzing stock issuance status. Utilizing diagrams to visually and intuitively convey data, it showcases a striking combination of blue and purple colors that stands out. It is particularly suitable for financial planning and funding needs, providing clear and reliable information to investors, making it useful for investment proposals or presentation materials. The slide is easy to edit, allowing complex data to be modified effortlessly.
Related Products
-
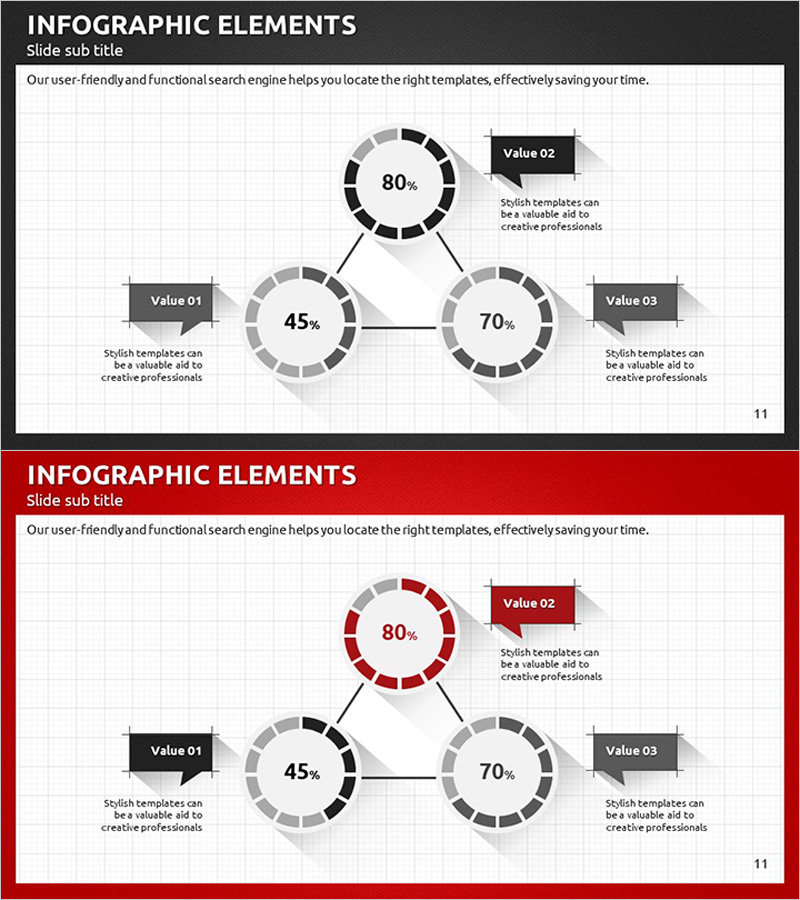
Modern Business Plan PowerPoint Template – Visualizing Financial Performance with Infographic Elements
#Product/Service #Financial Plans and Performance #Graph
-
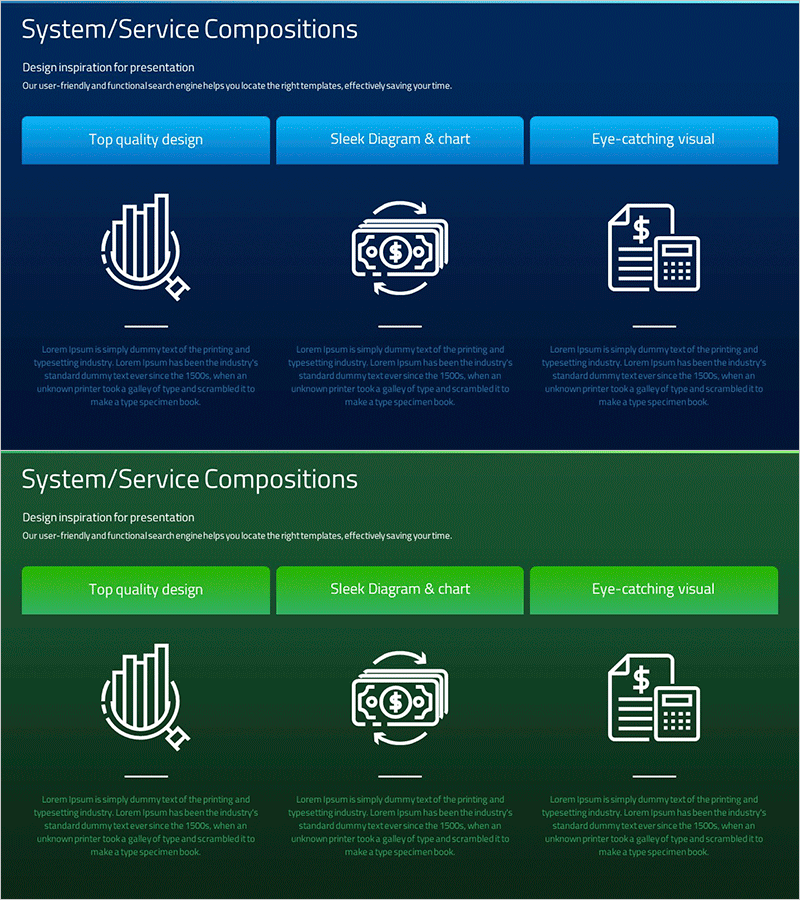
Introduction to Financial Technology Systems – Efficient Business Management
#Business Management #Technology Sector #Diagram
-
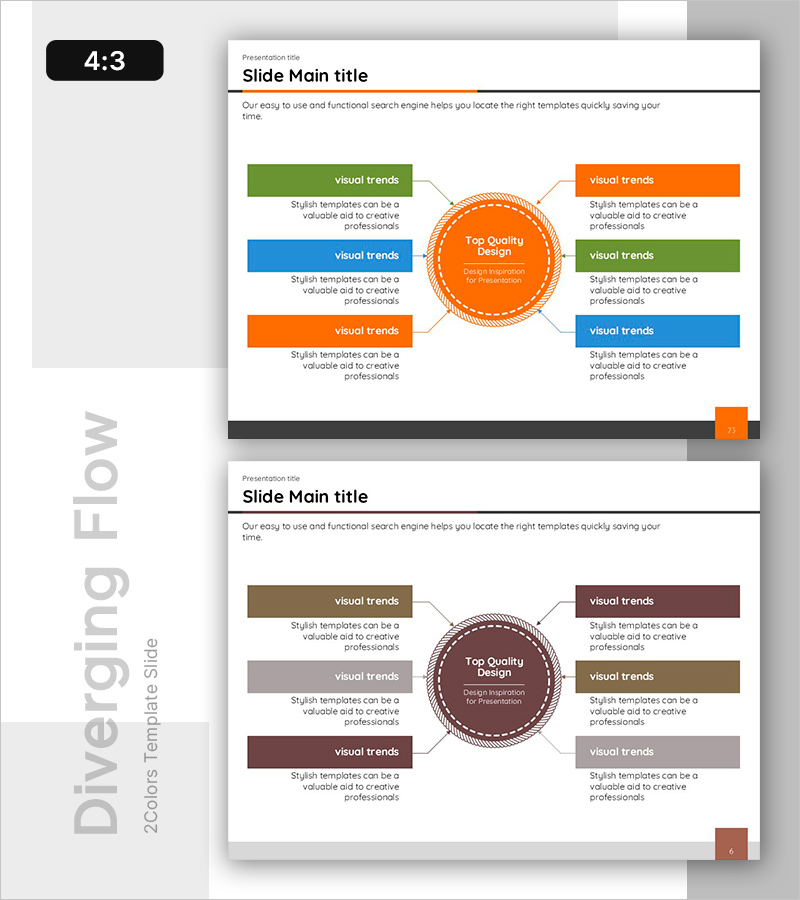
Diagram Towards the Center – Product/Service Introduction
#Product/Service #Diagram #Product/Service Introduction
-
Space Business Strategy Connection Diagram – Vision of Innovation
#Business Vision and Strategy #Marketing Plan and Strategy #Diagram
