Company Introduction
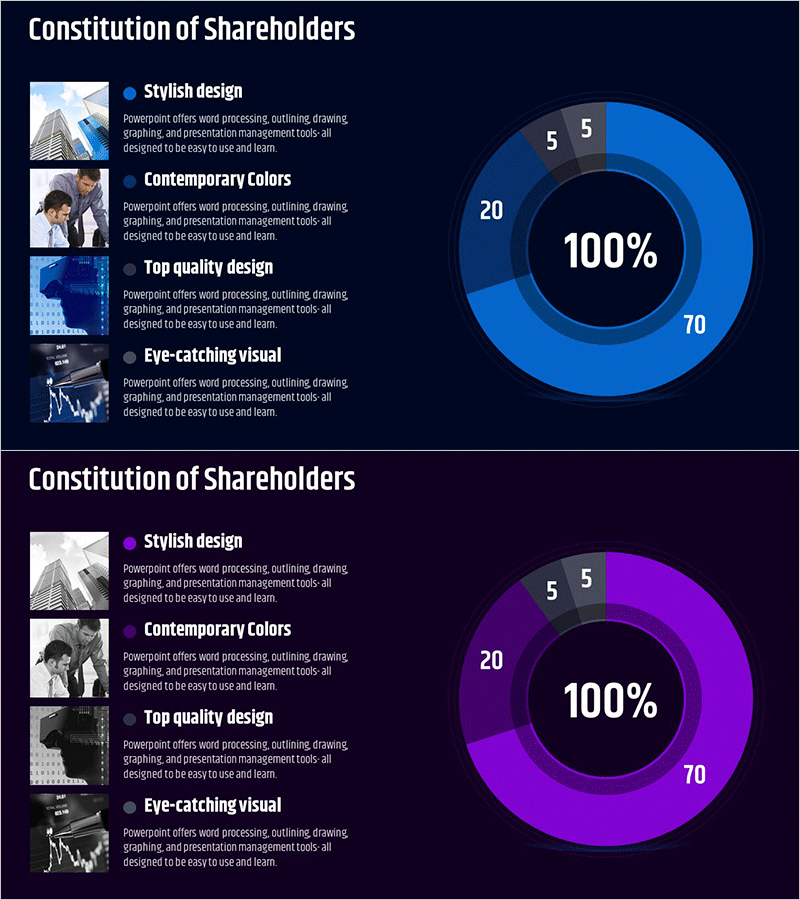
Major Shareholder Analysis Chart – Effective Market and Competitive Analysis
RM0600003_6
- Last Update 12/21/2025
- File Size 0.9MB
- # of Slides 2
- File Format PPTX
- Slide Ratio 16:9
- Color
Keywords
- #Content-Based Slides
- #Design-Based Slides
- #Company Introduction
- #Market and Competitor Analysis
- #Diagram
- #Graph
- #Shareholder Structure
- #Market Status
- #Cluster
- #Circles
- #Closed Cluster Diagram
- #Doughnut Chart
- #16:9
- #Major Shareholder Analysis
- #Market Analysis
- #Data Visualization
- #Competitive Analysis
- #Diagram
About the Product
This slide features a circular chart format that intuitively presents the composition of shareholders, utilizing blue and purple colors for a stylish visual effect. It clearly visualizes the proportions of shareholders with a total percentage of 100%, making it suitable for analyzing the shareholder structure of a company. Particularly useful for pre-market analysis or company introduction materials, its eye-catching design is beneficial for impressing key investors and executives. The text and data elements can be easily replaced, with an editing difficulty rated as 'medium', allowing for diverse applications.
Related Products
-
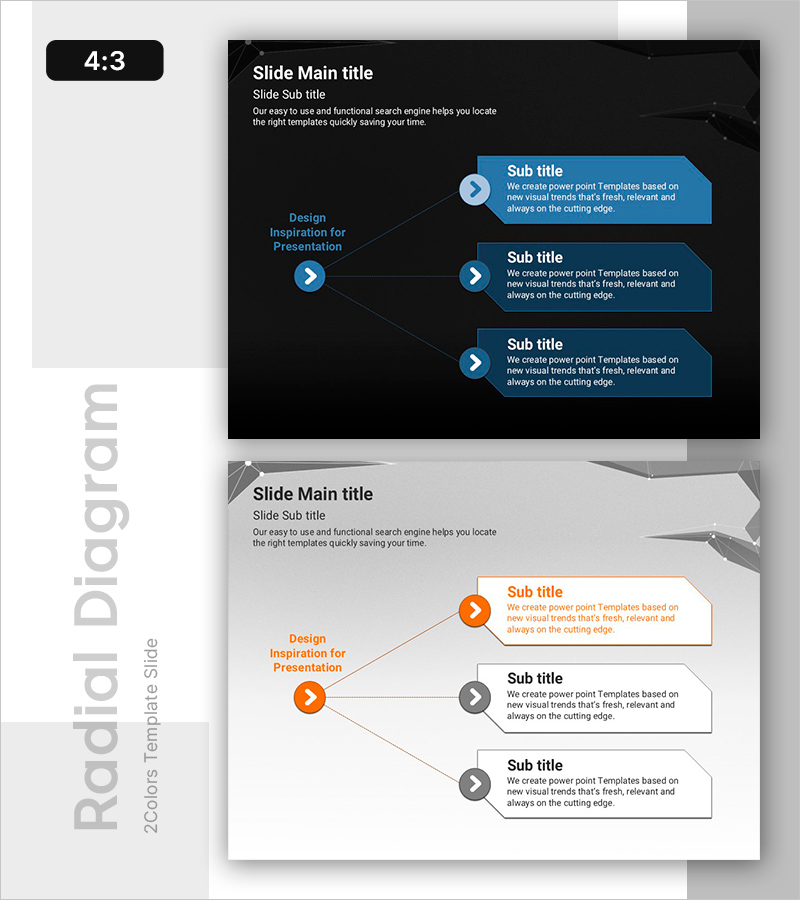
PowerPoint Slide on Three Directions – Business Overview
#Product/Service #Business Introduction #Diagram
-
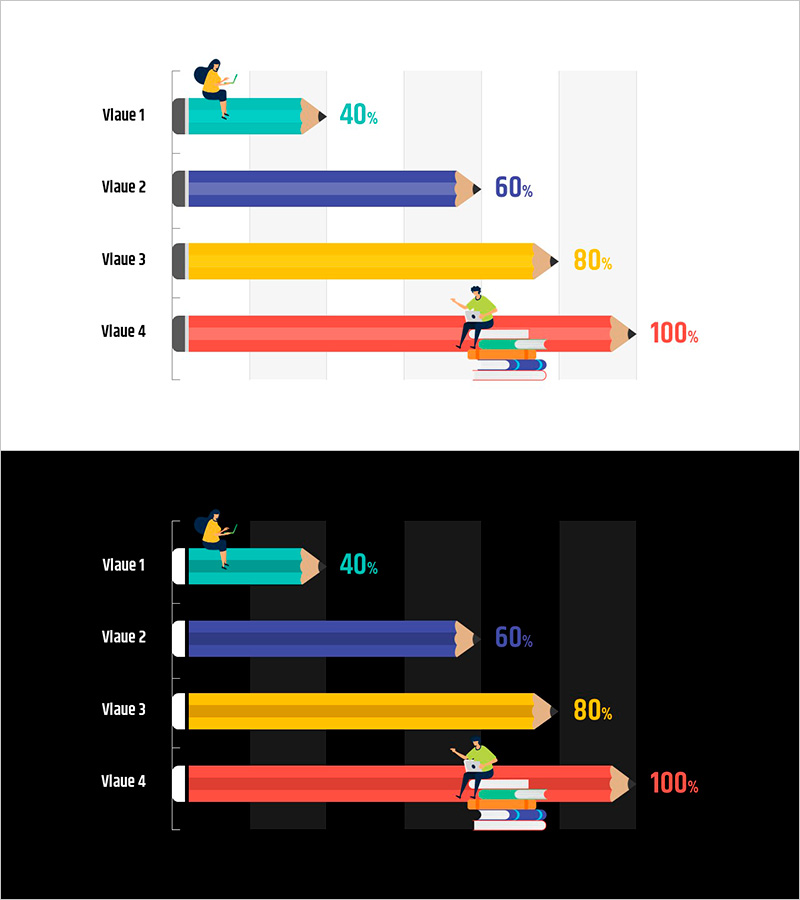
Pencil Horizontal Chart Competitive Advantage - Visualizing Market Status
#Market and Competitor Analysis #Graph #Other
-
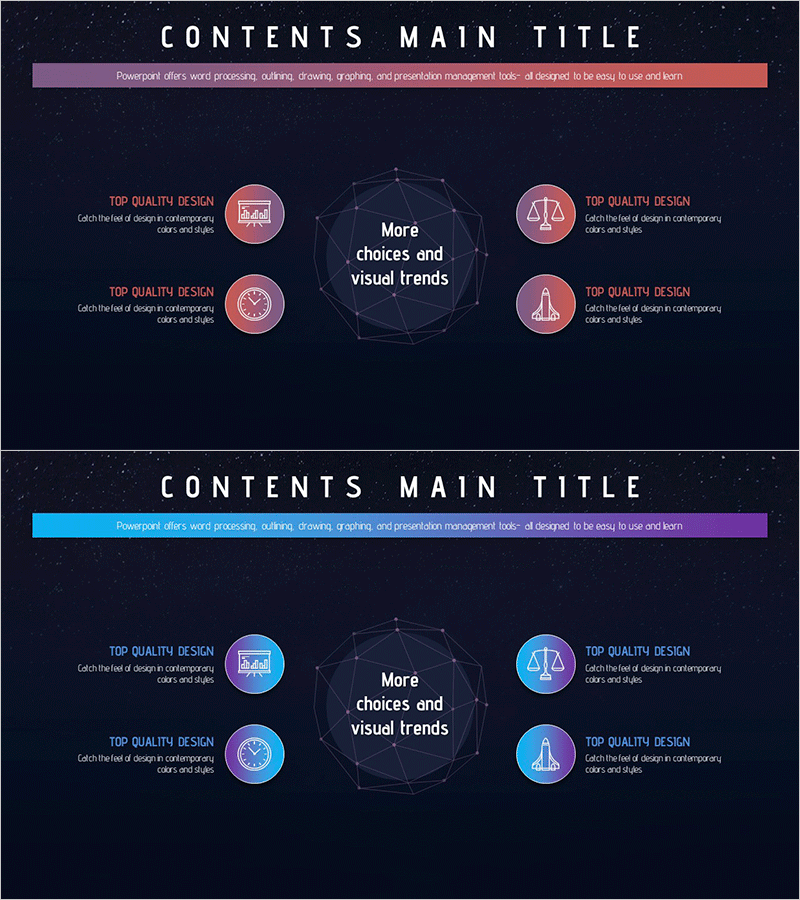
Space Industry Vision Diagram – Innovation and Growth Strategy
#Business Introduction #Business Vision and Strategy #Diagram
-
Navigation App Process and Implementation Plan
#Business Management #Operation Plan #Diagram
