Business Introduction
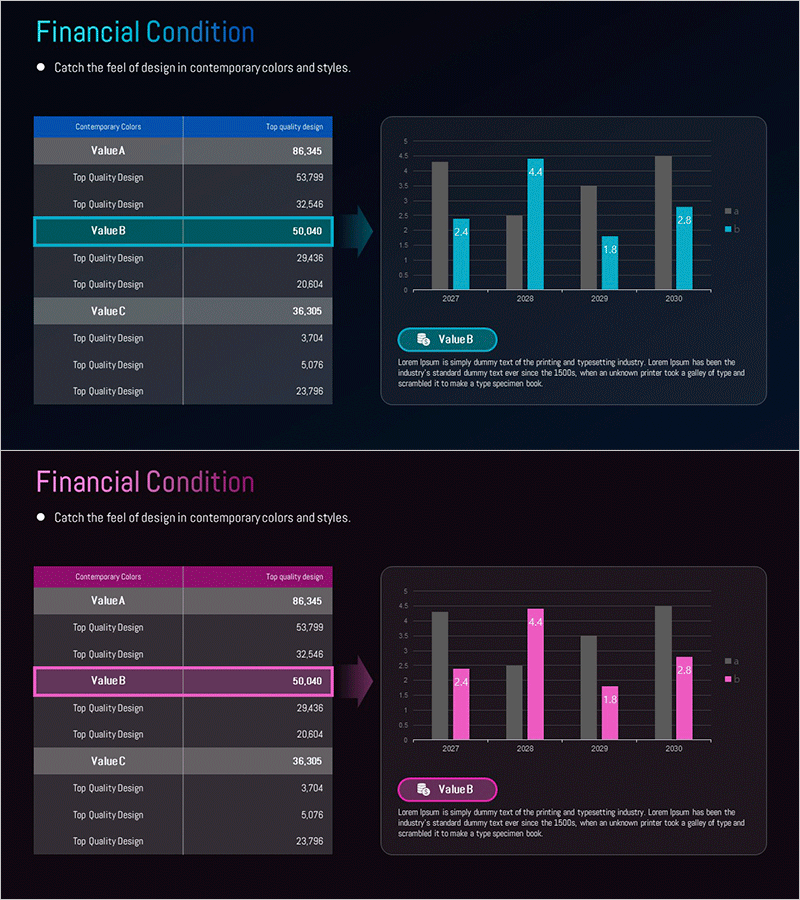
Financial Status Analysis Chart – Business Introduction and Future Insights
RM0500005_7
- Last Update 12/21/2025
- File Size 0.3MB
- # of Slides 2
- File Format PPTX
- Slide Ratio 16:9
- Color
Keywords
- #Content-Based Slides
- #Design-Based Slides
- #Business Introduction
- #Market and Competitor Analysis
- #Diagram
- #Graph
- #Future Outlook
- #Table
- #Column
- #Standard Table
- #Grouped Column
- #16:9
- #Financial Status Analysis
- #Bar Chart
- #Business Introduction
- #Market and Competitive Analysis
- #Future Insights
- #Business
- #Report
About the Product
This slide utilizes bar and column charts to visualize the financial status and future business outlook. The combination of contemporary blue and purple colors provides a modern and professional feel, aiding in data comparison and market insights. It’s suitable for business introductions and competitive analysis reports, serving as a powerful visual tool for financial planning and performance analysis. The slide includes replaceable text and data, with a moderate editing difficulty designed for ease of use.
Related Products
-

Cybersecurity Service Structure Diagram
#Company Introduction #Technology Sector #Diagram
-

Green Red Radial Chart Analysis – Innovation in Data Visualization
#Product/Service #Graph #Features
-
Sales and Profit Calculation Table – Essential Tool for Business Strategy
#Business Promotion Strategy #Financial Plans and Performance #Diagram
-
Efficient Business Strategy Presentation through the Work System Box
#Business Promotion Strategy #Operation Plan #Diagram
