Financial Plans and Performance
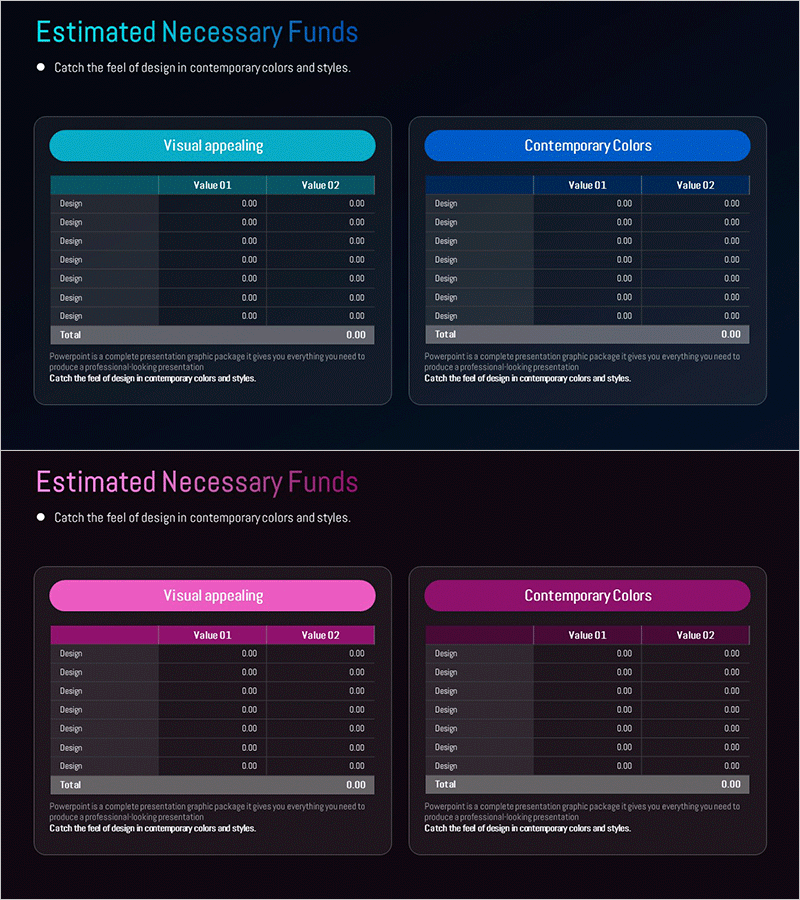
Expected Return on Investment Chart – Visualizing Financial Performance
RM0500005_27
- Last Update 12/21/2025
- File Size 0.2MB
- # of Slides 2
- File Format PPTX
- Slide Ratio 16:9
- Color
Keywords
About the Product
This slide features a chart that visually represents the expected return on investment. With a modern color and design, it effectively communicates financial performance. It displays information clearly in a table format, making it suitable for budget-related reports or business strategy presentations. The harmonious blend of blue and purple gives it a sophisticated feel, and slide editing is straightforward. This slide is particularly useful for financial analysis or investment opportunity explanations and can be adapted to various presentations with simple data changes.
Related Products
-
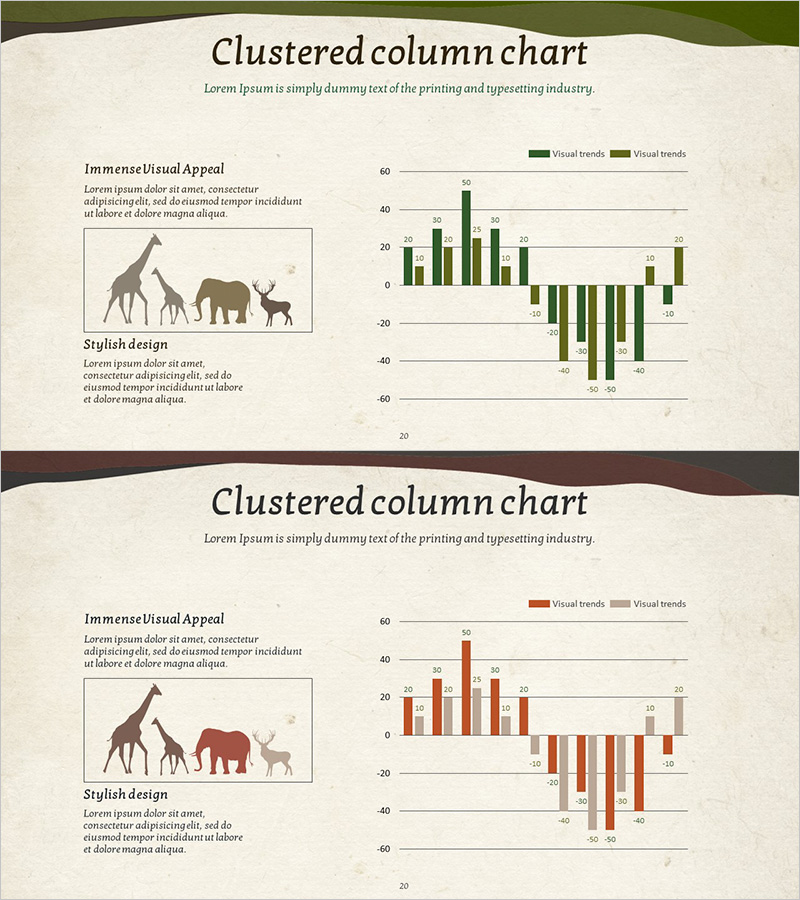
Animal Nature Conservation Program Facility Investment Plan Chart
#Market and Competitor Analysis #Financial Plans and Performance #Graph
-

Interior Business Awards Visualization Slide
#Company Introduction #Diagram #Awards and Certifications, and Patents
-
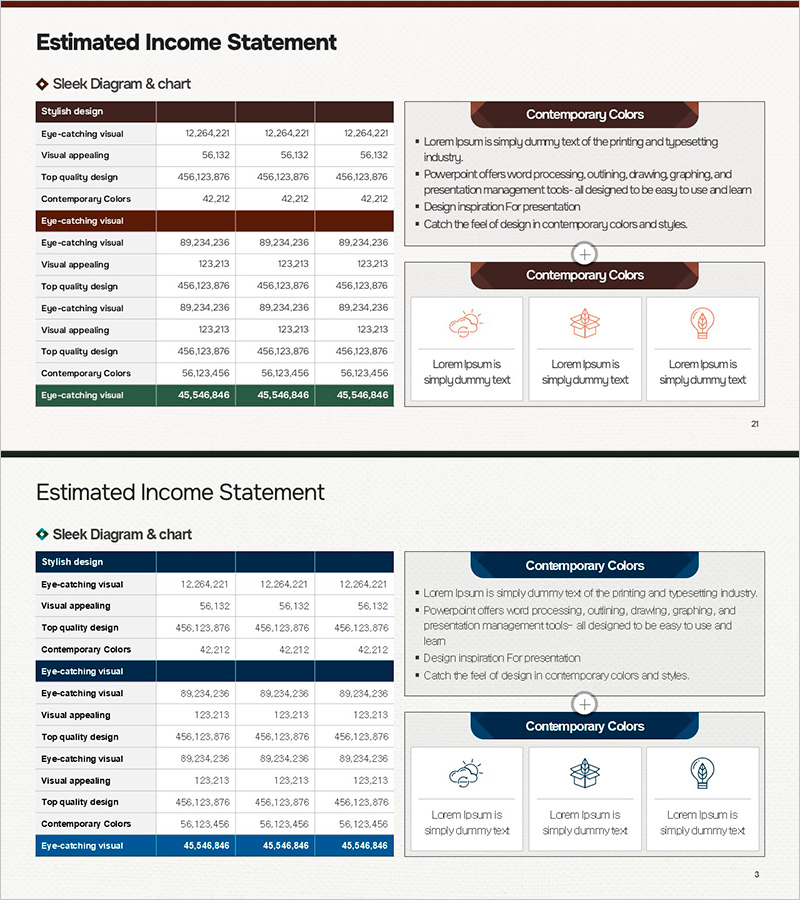
Visualizing Projected Income, Expenses, and Key Metrics by Business
#Financial Plans and Performance #Diagram #Text Box
-
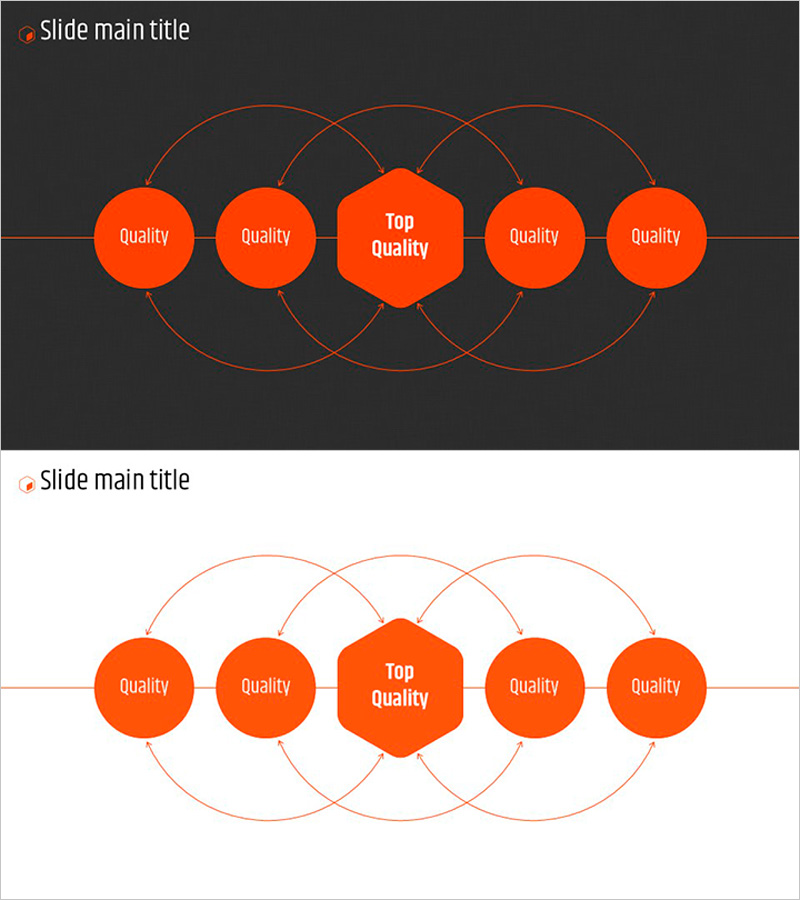
Orange Hexagon Diagram – Business Vision and Strategy
#Business Vision and Strategy #Diagram #Business Vision
