Financial Plans and Performance
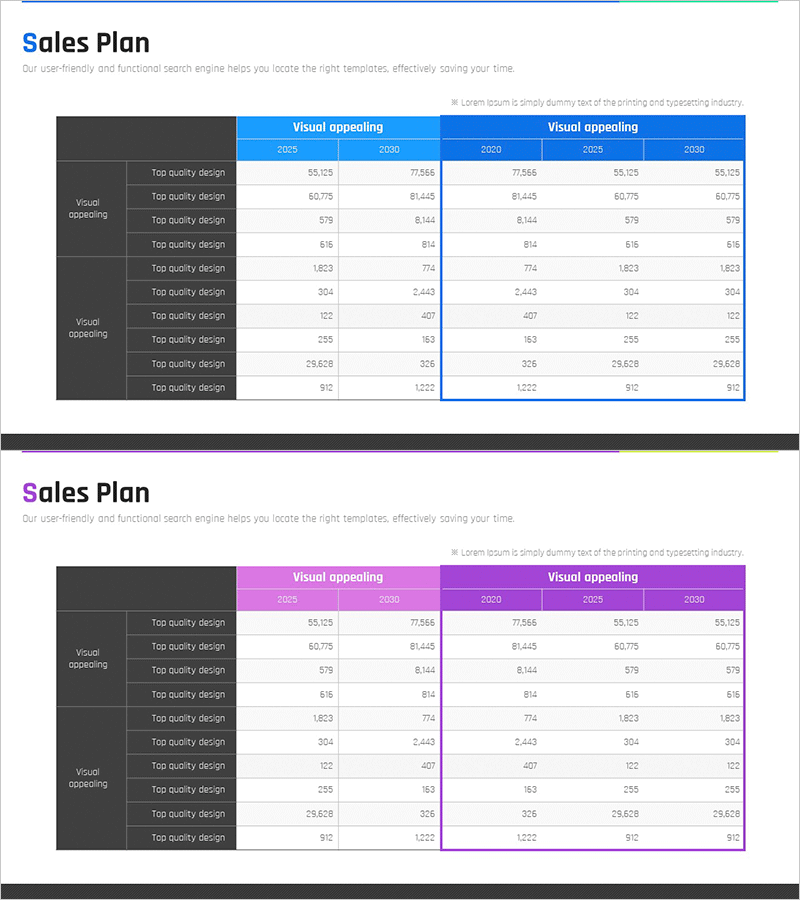
Table of Brand Sales Performance by Year – Financial Planning and Results
RM0400012_28
- Last Update 12/21/2025
- File Size 1MB
- # of Slides 2
- File Format PPTX
- Slide Ratio 16:9
- Color
Keywords
About the Product
This slide meticulously presents brand sales performance by year in a table format. The harmonious blend of blue and purple enhances professionalism, while the data structure allows for clear comparison of annual performance. Ideal for financial planning, performance analysis, investor presentations, or internal reports, its simple editing feature enables swift content modification. Editing difficulty is rated as 'easy', ensuring users can utilize it immediately during their presentations.
Related Products
-
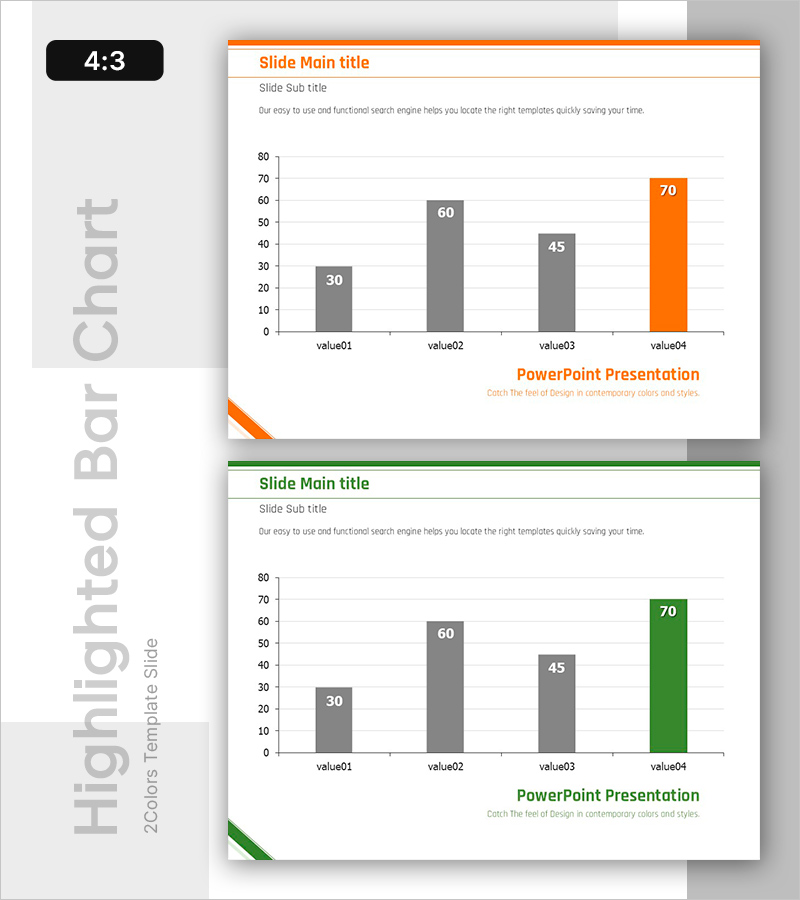
Highlighted Vertical Bar Graph (Green & Orange) – Clear Visualization for Data Comparison
#Market and Competitor Analysis #Financial Plans and Performance #Graph
-
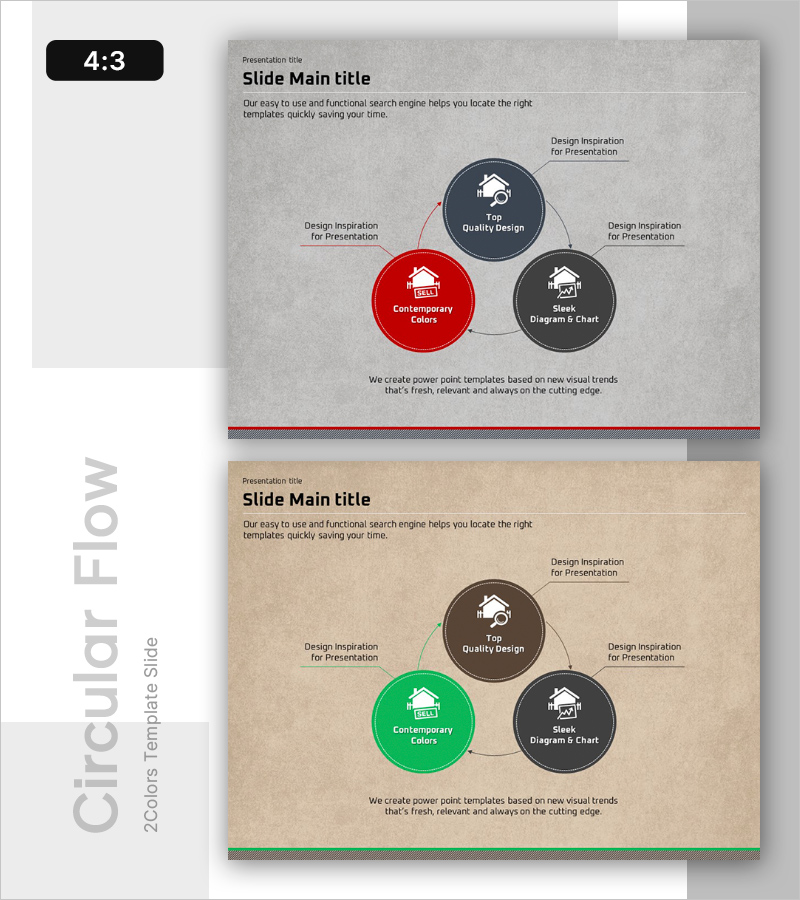
Real Estate Transaction Flow System – Operations and Technology Department
#Operation Plan #Technology Sector #Diagram
-
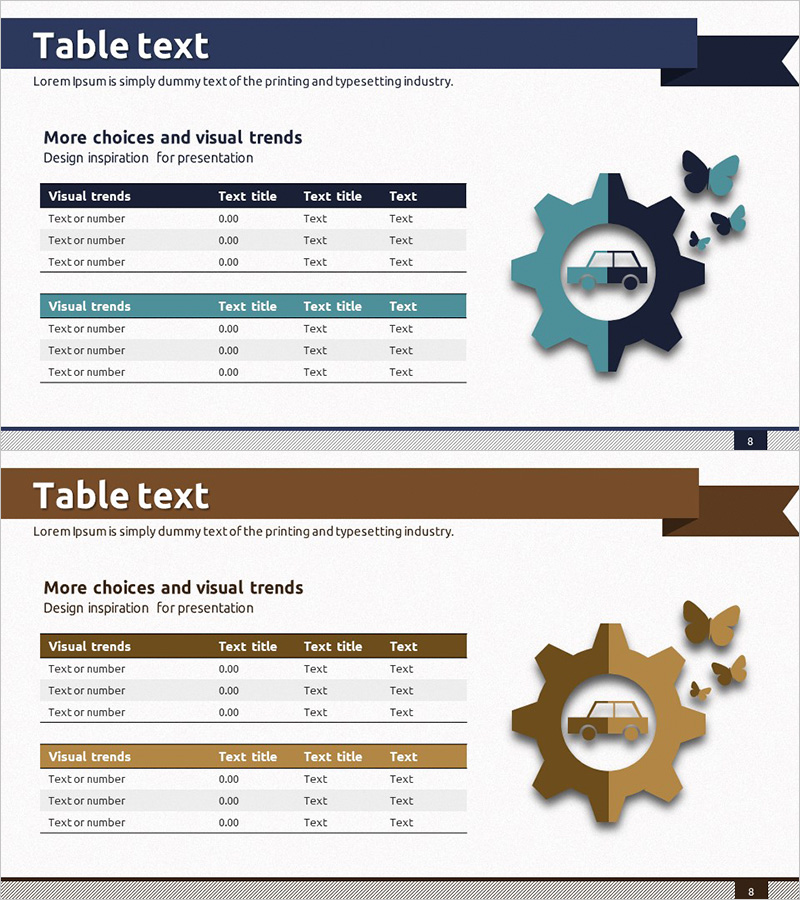
Environmental Protection Expected Return on Investment Table – Finance Planning and Performance
#Financial Plans and Performance #Diagram #Key Financial Indicators
-
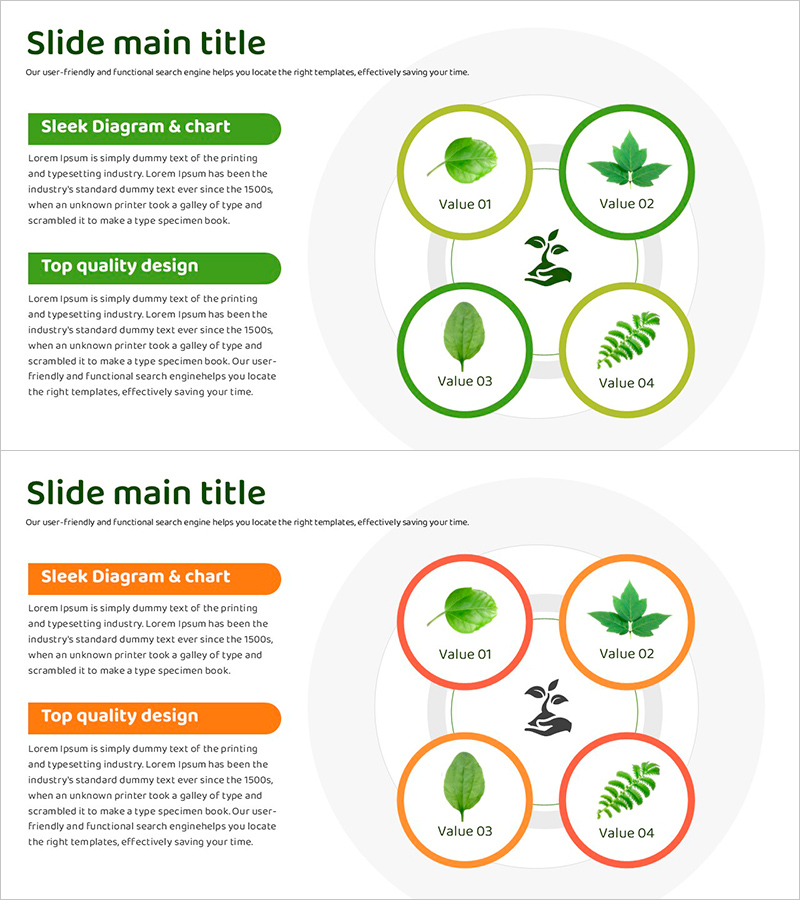
Leaf Type Diagram – Visualizing Business Vision and Strategy
#Business Introduction #Business Vision and Strategy #Diagram
