Financial Plans and Performance
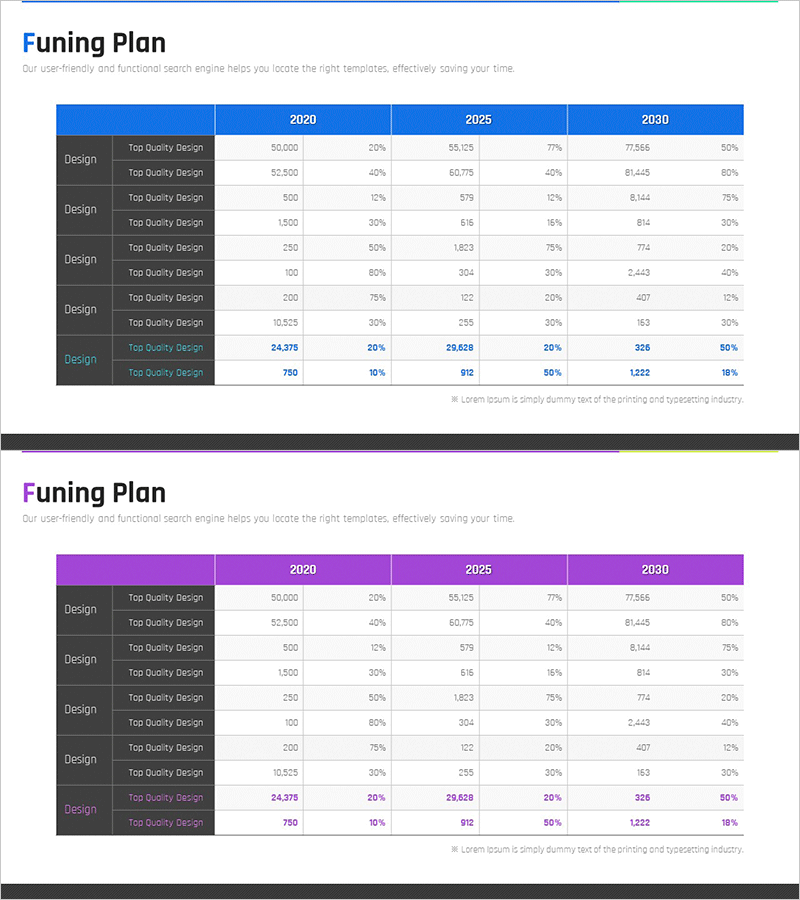
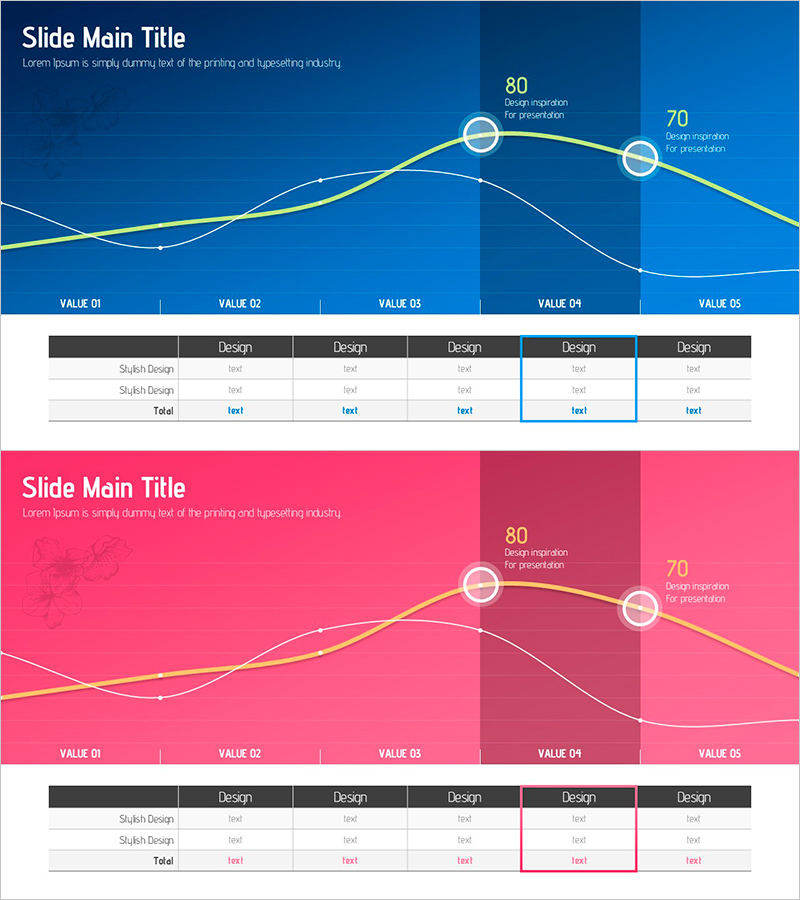
Chart of Funding Structure Analysis by Year – Optimized for Financial Planning
RM0400012_27
- Last Update 12/21/2025
- File Size 1MB
- # of Slides 2
- File Format PPTX
- Slide Ratio 16:9
- Color
Keywords
About the Product
This slide provides a diagram-based visual analysis of the funding structure by year. With a clear table layout and diverse color combinations, it effectively conveys complex financial data, making it attractive to investors and executives. The design, primarily in blue and purple, emphasizes professionalism while facilitating easy access to critical data.
Related Products
-
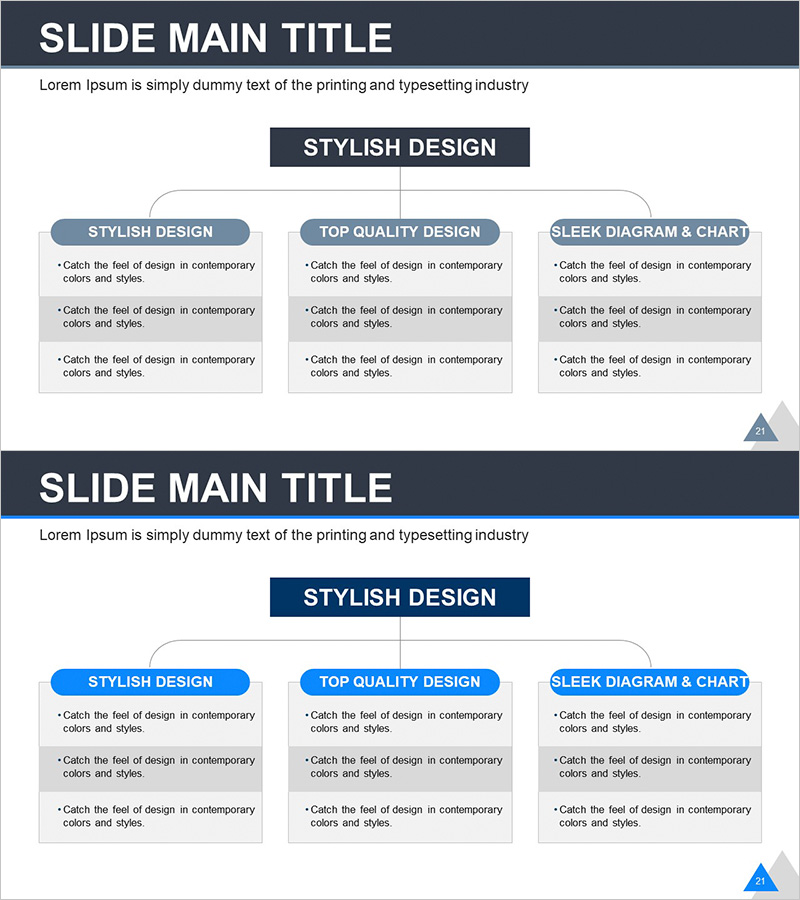
Organizational Chart Diagram – Clear Structure Presentation
#Company Introduction #Diagram #Organizational Chart
-
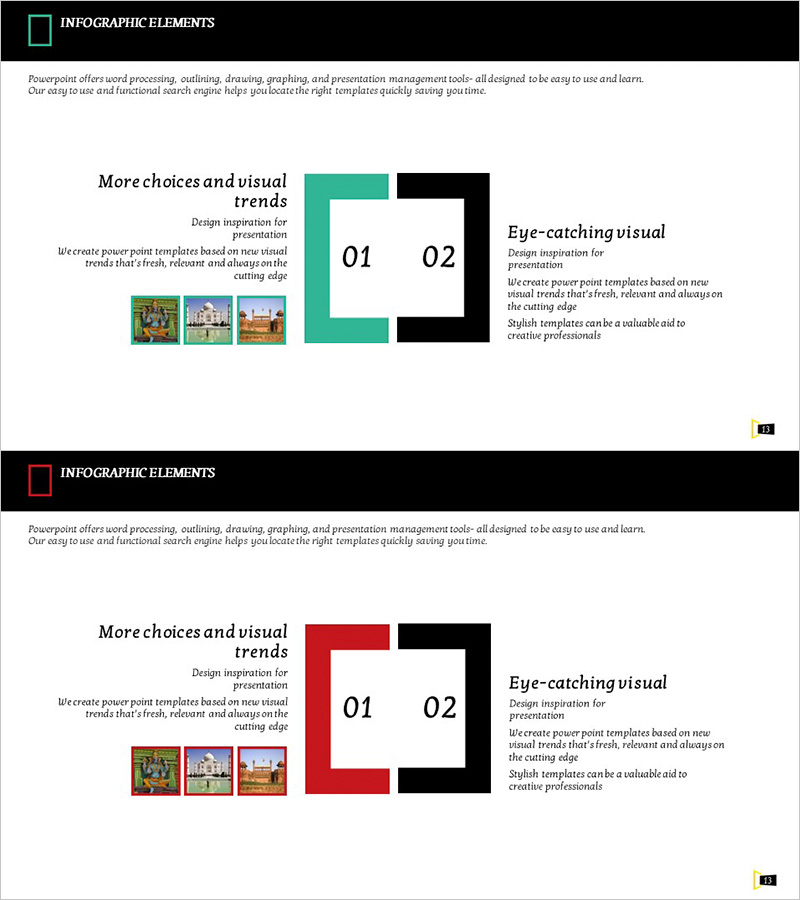
Future Prospects and Expected Effects of India Travel Business – Perfectly Illustrated with Cluster Diagram
#Business Vision and Strategy #Diagram #Business Strategy
-
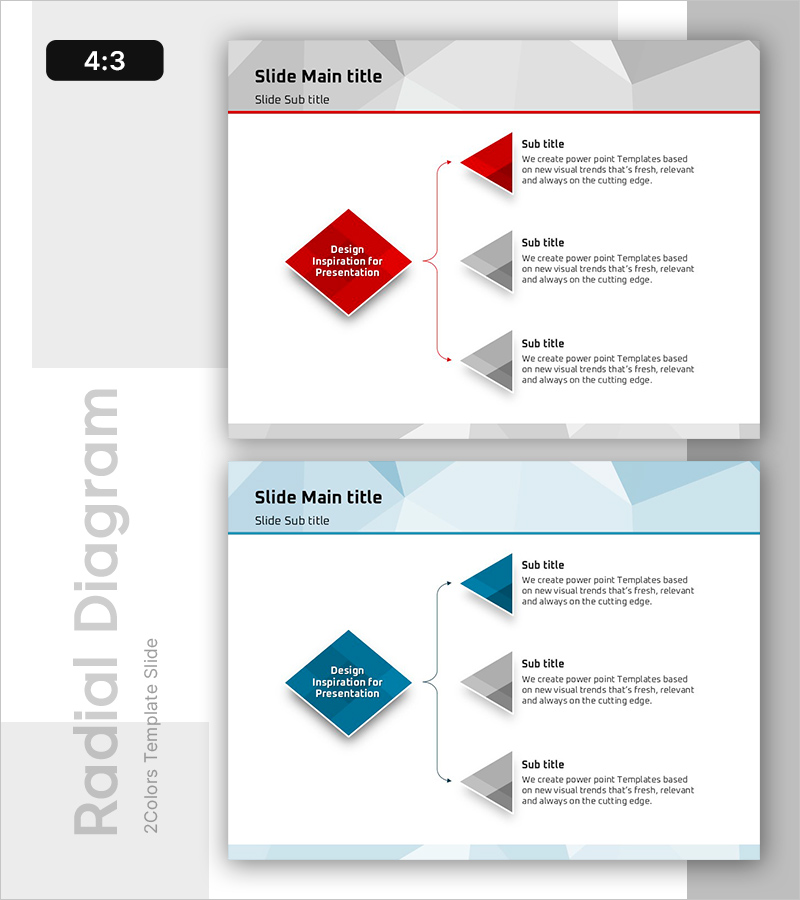
Exploring Three Strategic Paths for Growth – Business Innovation Strategies
#Product/Service #Diagram #Product/Service Introduction
-
Analysis of Sales Growth Segments Slide
#Technology Sector #Market and Competitor Analysis #Diagram
