Financial Plans and Performance
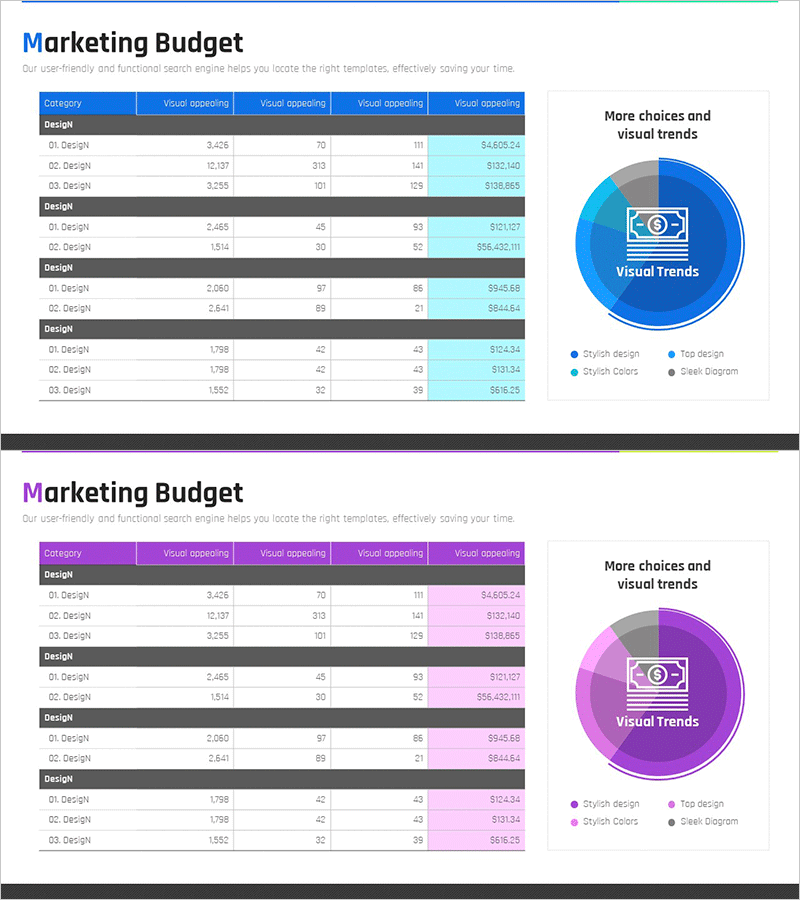
Annual Marketing Budget Analysis Chart - Visualizing Financial Performance
RM0400012_26
- Last Update 12/21/2025
- File Size 1MB
- # of Slides 2
- File Format PPTX
- Slide Ratio 16:9
- Color
Keywords
About the Product
This slide features a pie chart template designed to present annual marketing budget data at a glance. With a clear layout that visually separates information, the main colors blue and purple add trust and professionalism. It's suitable for financial performance and budget analysis reports, allowing users to easily replace text and data. The editing difficulty is moderate, making it easy to integrate into various presentation materials.
Related Products
-
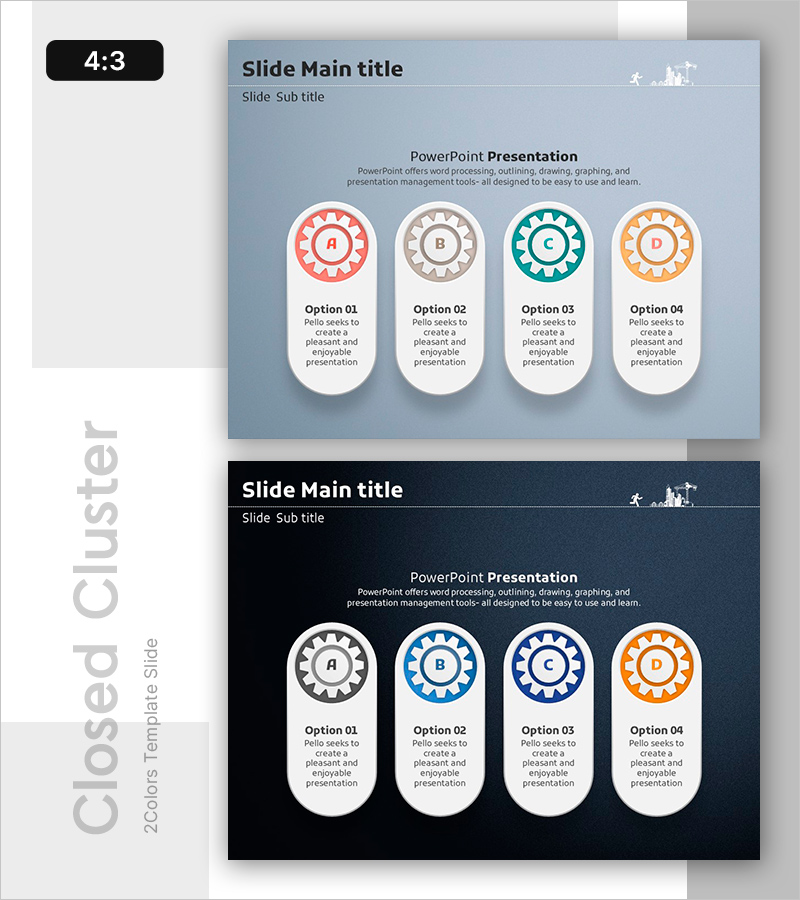
Visualizing Equipment Operation and Maintenance Strategy Slides
#Operation Plan #Diagram #Production and Technological Development Strategy
-
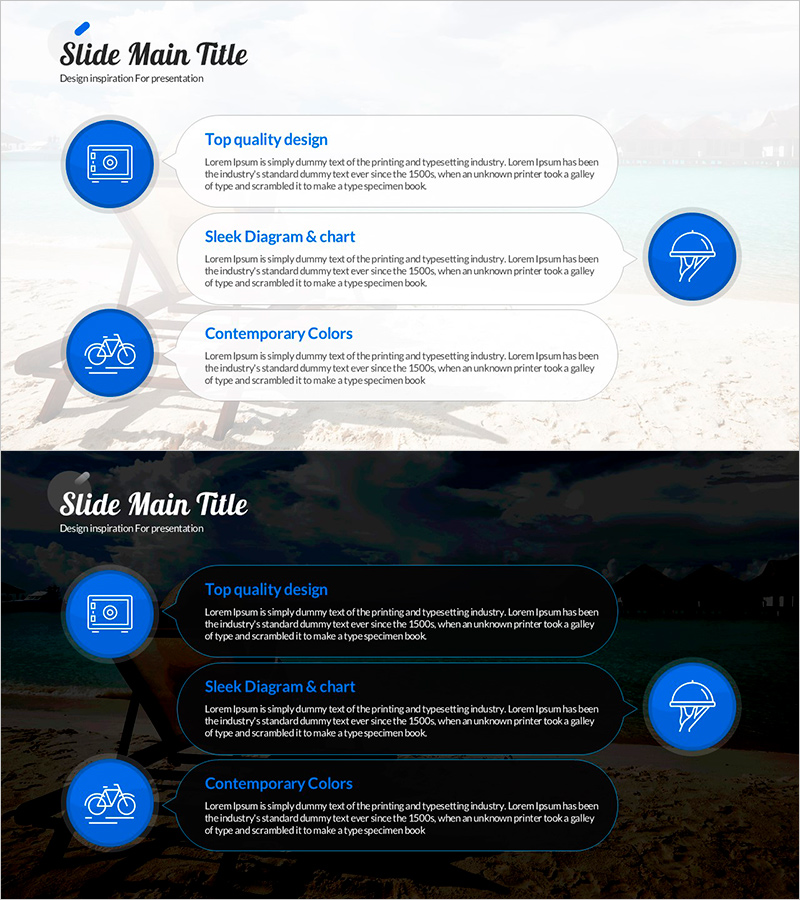
How to Enjoy Leisure Time While Traveling – Modern Design Relaxation
#Product/Service #Diagram #Text Box
-
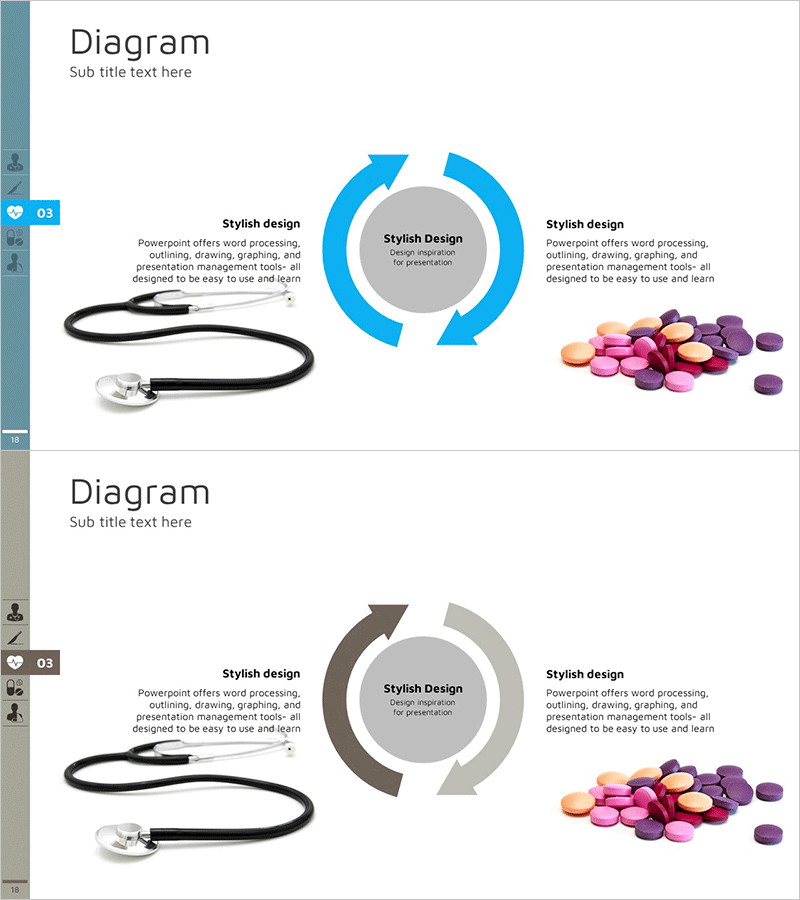
Medical Business Goals Circular Diagram – Insights on Design and Strategy
#Business Vision and Strategy #Diagram #Business Goals
-
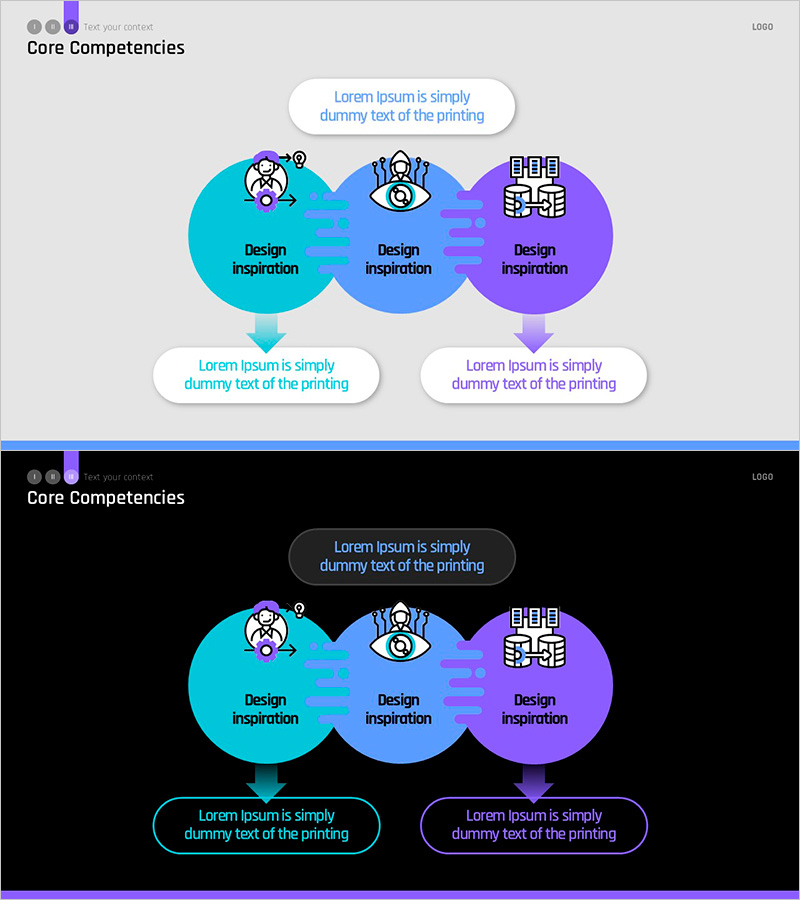
Infographic Slide Visualizing Core Competencies
#Company Introduction #Business Vision and Strategy #Diagram
