Product/Service
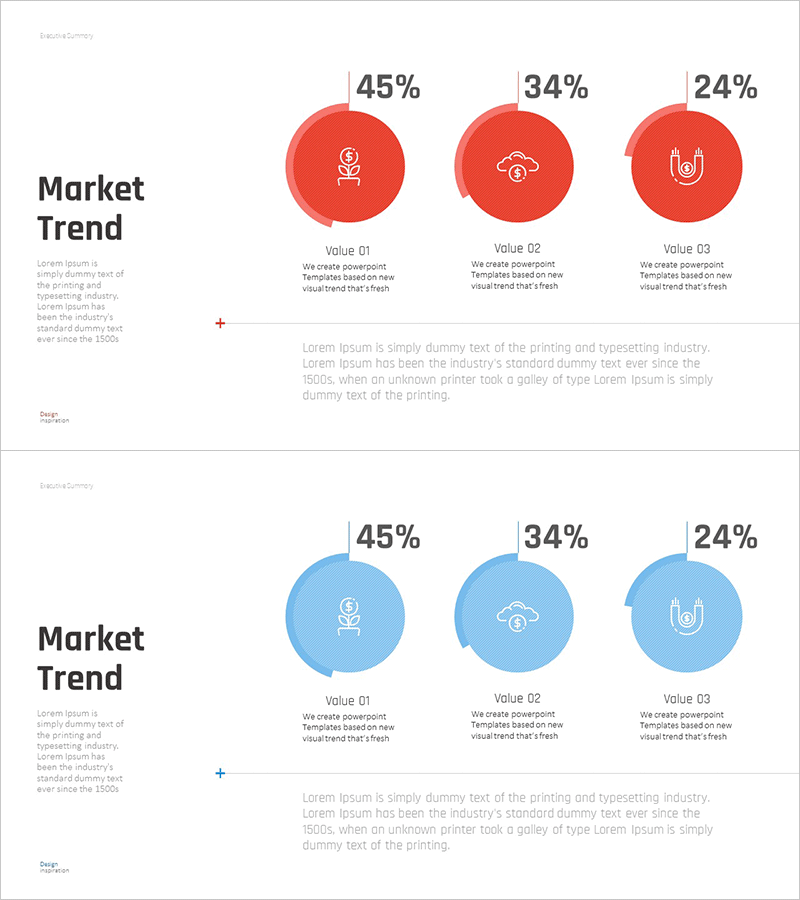
Market Trend Change Analysis Graph – Key Insights Visualization
RM0400009_6
- Last Update 12/21/2025
- File Size 0.7MB
- # of Slides 2
- File Format PPTX
- Slide Ratio 16:9
- Color
Keywords
About the Product
This slide utilizes a donut-shaped graph to visually convey market trends and changes. The simple layout ensures clear data presentation, and the vibrant red and blue color combination enhances visibility. It effectively illustrates key market fluctuations, making it suitable for strategy planning documents, reports, or investment pitches. With easily editable text and data sections, it is rated as 'easy' in terms of editing difficulty, allowing for quick adaptation to various presentation materials.
Related Products
-
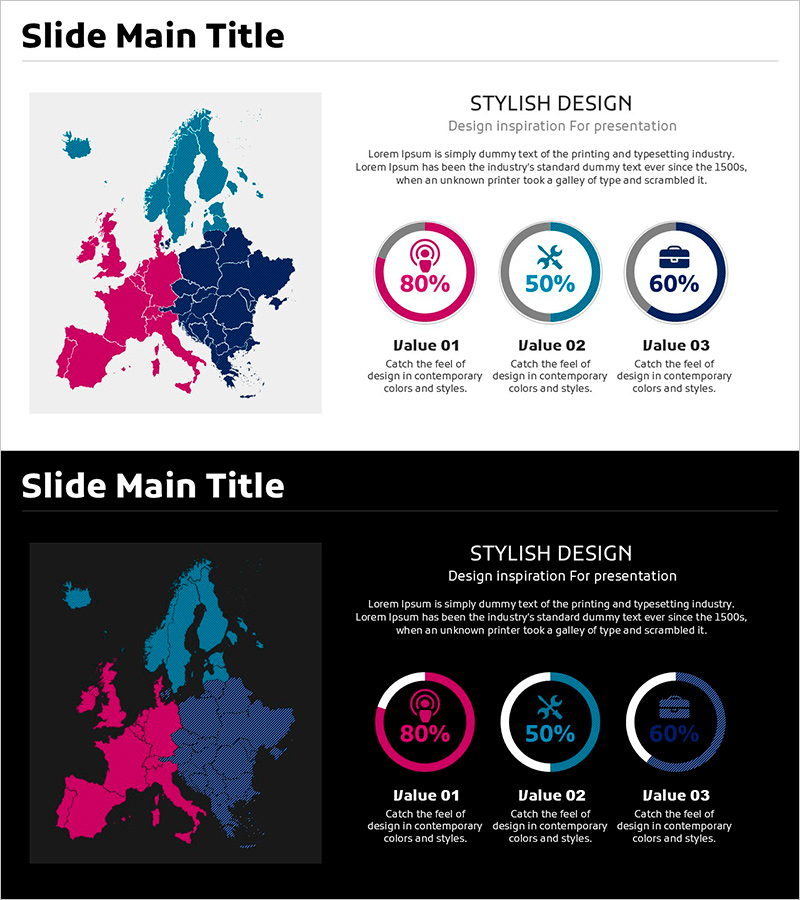
Donut Chart in Overseas Markets – Market Share Analysis
#Market and Competitor Analysis #Graph #Other
-
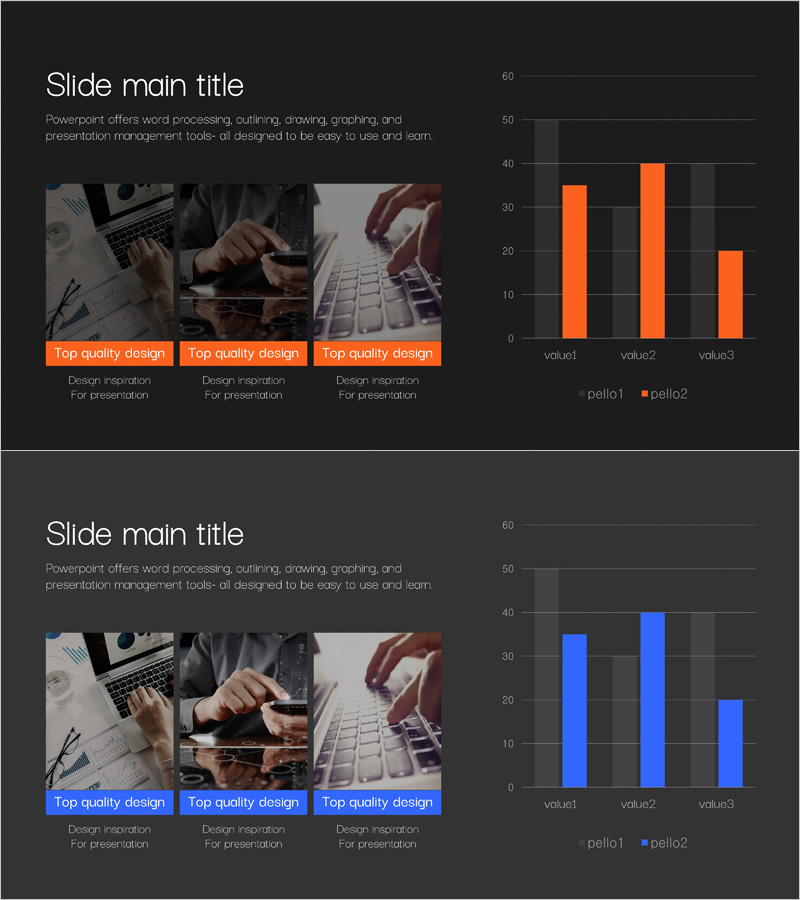
Business Market Analysis Bar Graph – Visualizing Competitive Analysis
#Market and Competitor Analysis #Diagram #Graph
-

Black-and-white Car Photographs and Text – Product Introduction
#Product/Service #Product/Service Introduction #Features
-

Planet Image PC Mockup Slide – Creative and Attractive Design
#Product/Service #Other #Product/Service Introduction
