Financial Plans and Performance
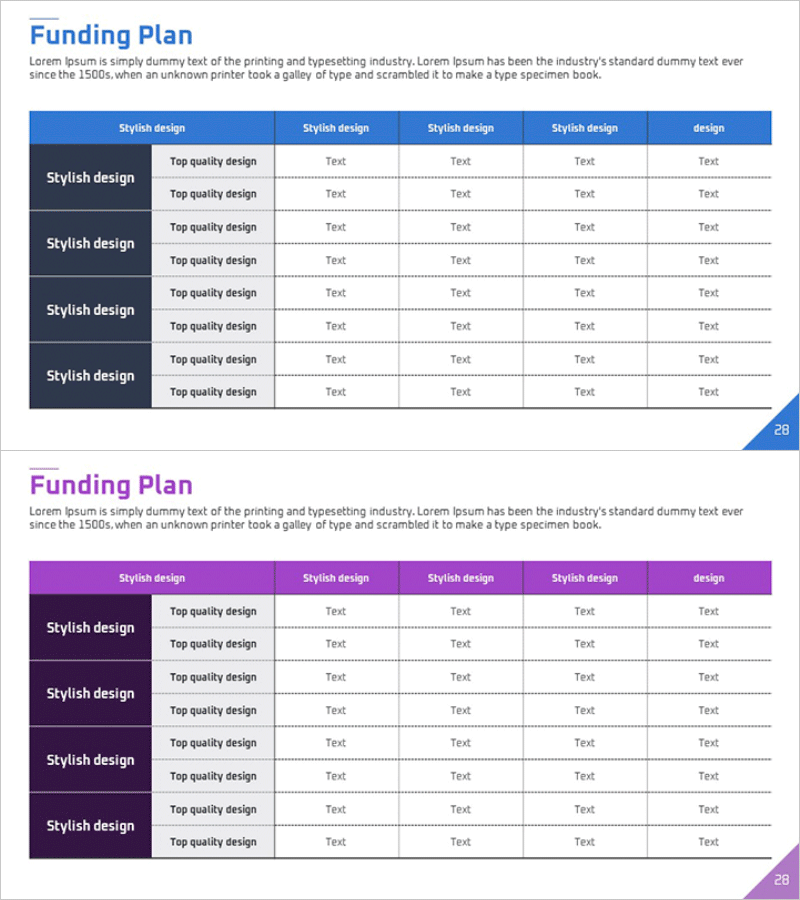
Funding Plan Chart – Financial Performance Analysis
RM0400002_27
- Last Update 12/21/2025
- File Size 1MB
- # of Slides 2
- File Format PPTX
- Slide Ratio 16:9
- Color
Keywords
About the Product
This slide presents a visually appealing chart for depicting funding plans. Its sleek and simple design effectively communicates financial management strategies to investors or executives. The blue and purple color scheme exudes trust, while the clean table layout organizes necessary information efficiently. It serves as a powerful tool when conveying financial plans or key performance indicators. The text and data are easily editable, resulting in relatively simple editing and replacement.
Related Products
-
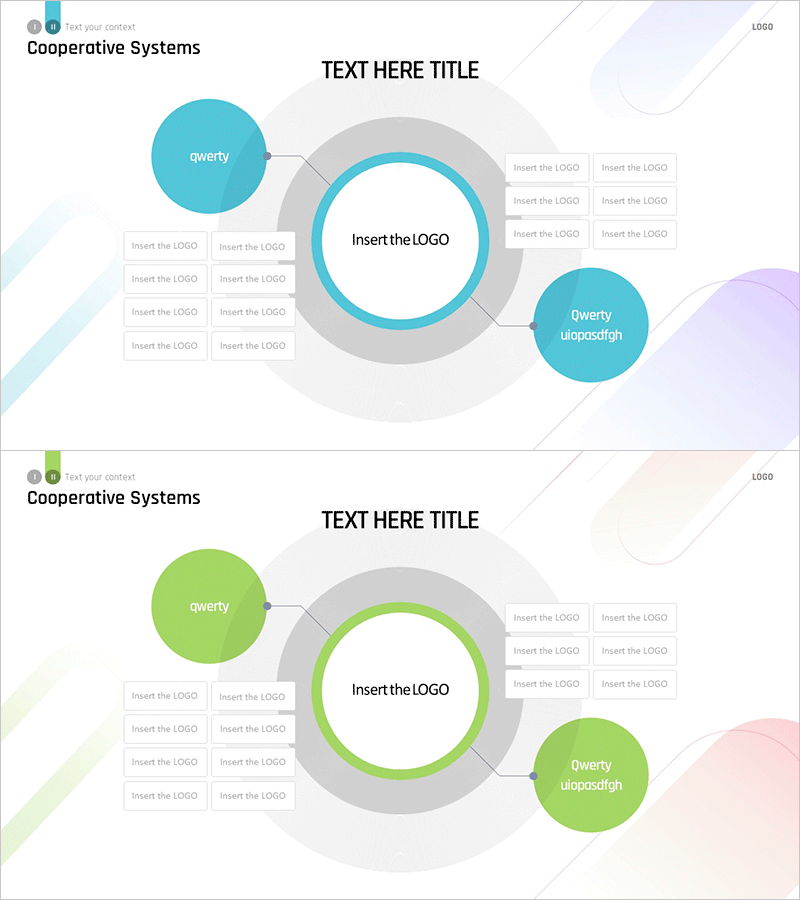
Cooperative Systems Diagram – Visualizing Technical Integration
#Product/Service #Technology Sector #Diagram
-
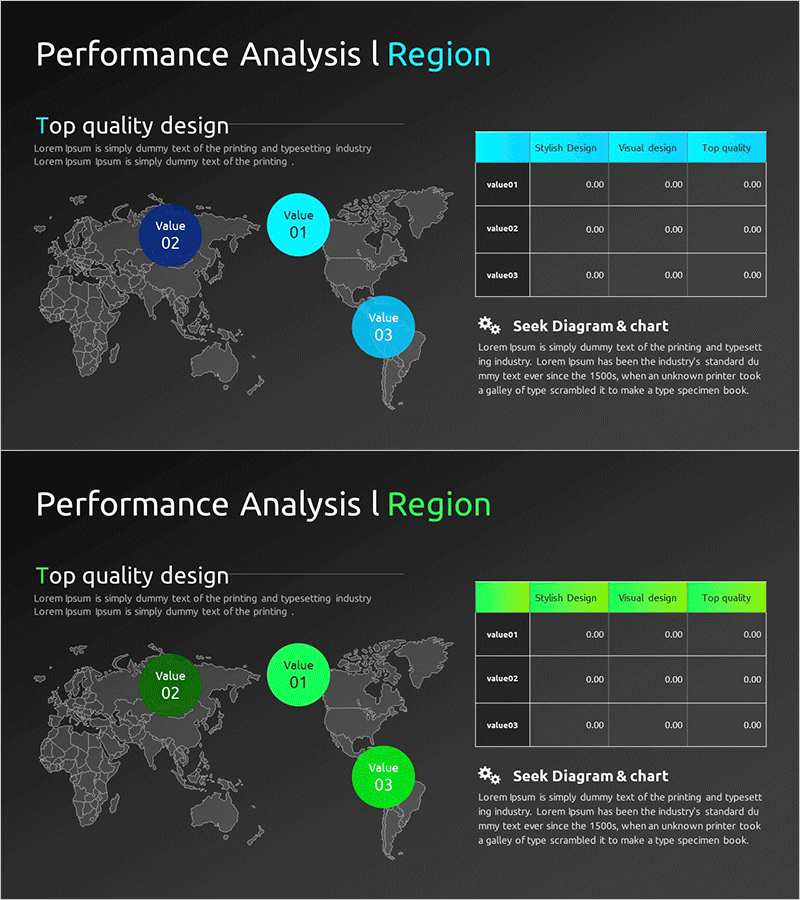
Global Regional Market Performance Analysis - Providing Business Insight
#Company Introduction #Market and Competitor Analysis #Diagram
-

Experimental Achievement Goal Strategy PowerPoint Template – Cluster Design
#Business Introduction #Marketing Plan and Strategy #Diagram
-

Business Goal Label Shape Diagram – Visual Cluster Representation
#Business Vision and Strategy #Diagram #Text Box
