Company Introduction
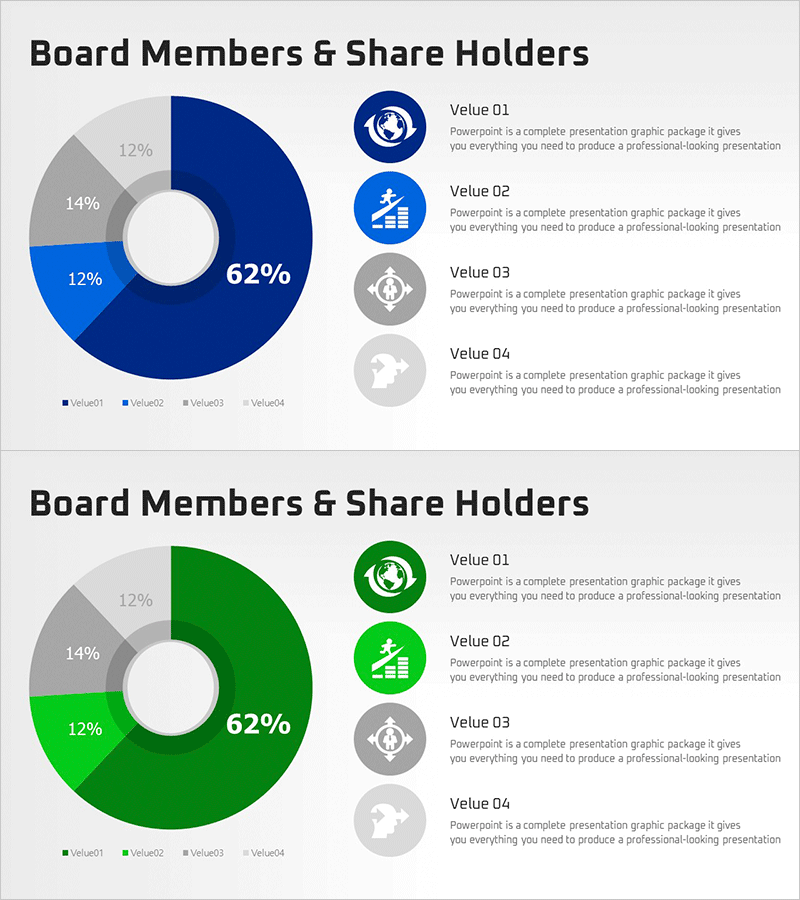
Global Business Growth Analysis Status Graph
RM0300021_7
- Last Update 12/21/2025
- File Size 0.3MB
- # of Slides 2
- File Format PPTX
- Slide Ratio 16:9
- Color
Keywords
- #Content-Based Slides
- #Design-Based Slides
- #Company Introduction
- #Market and Competitor Analysis
- #Diagram
- #Graph
- #Shareholder Structure
- #Market Analysis
- #Cluster
- #Circles
- #Closed Cluster Diagram
- #Doughnut Chart
- #16:9
- #Global business analysis
- #Shareholder status
- #Market analysis
- #Corporate introduction slide
About the Product
This slide features a donut chart designed for the analysis of global business growth, effectively presenting shareholder status. The chart illustrates various percentages, making it ideal for market analysis. A combination of blue, green, and gray colors emphasizes trustworthiness and professionalism, with user-friendly visual elements neatly arranged. This slide has high versatility in shareholder presentations or investment analysis reports, assisting in the graphic understanding of shareholder structure and proportions. It is easy to edit, allowing for quick content modification or replacement.
Related Products
-
Proposal General Provisions Introduction Slide – Business Overview and Strategy
#Company Introduction #Business Introduction #Business Vision and Strategy
-
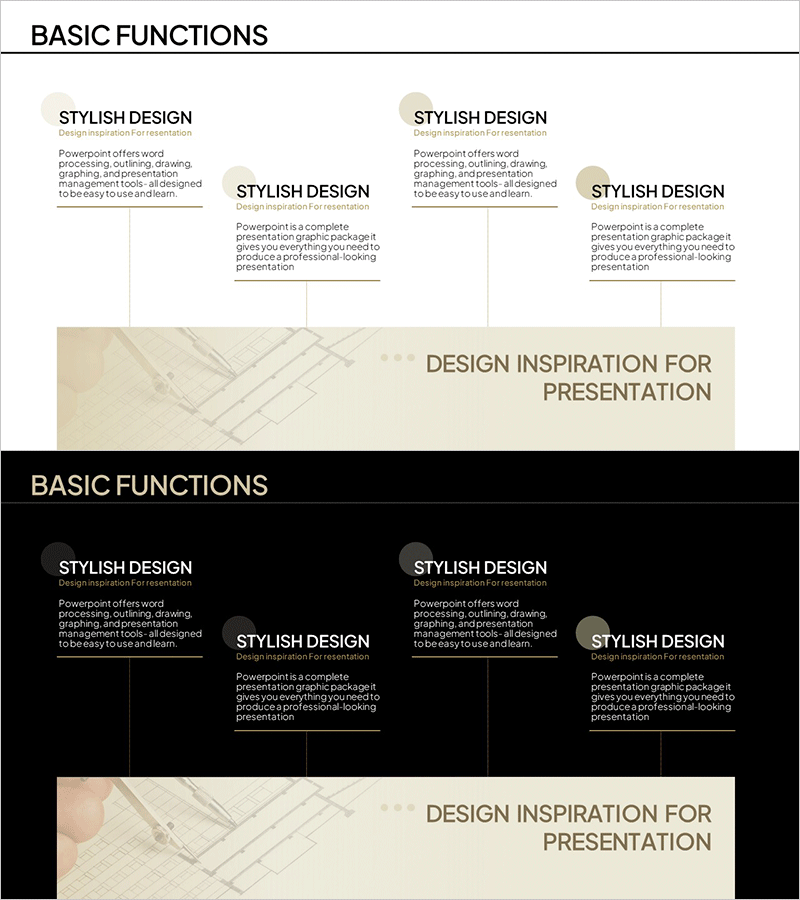
Introduction to Basic Business Functions Diagram – Effective Business Understanding
#Company Introduction #Business Introduction #Diagram
-
Competitor and Target Research Chart – Market Analysis and Competitive Advantage
#Market and Competitor Analysis #Diagram #Market Analysis
-
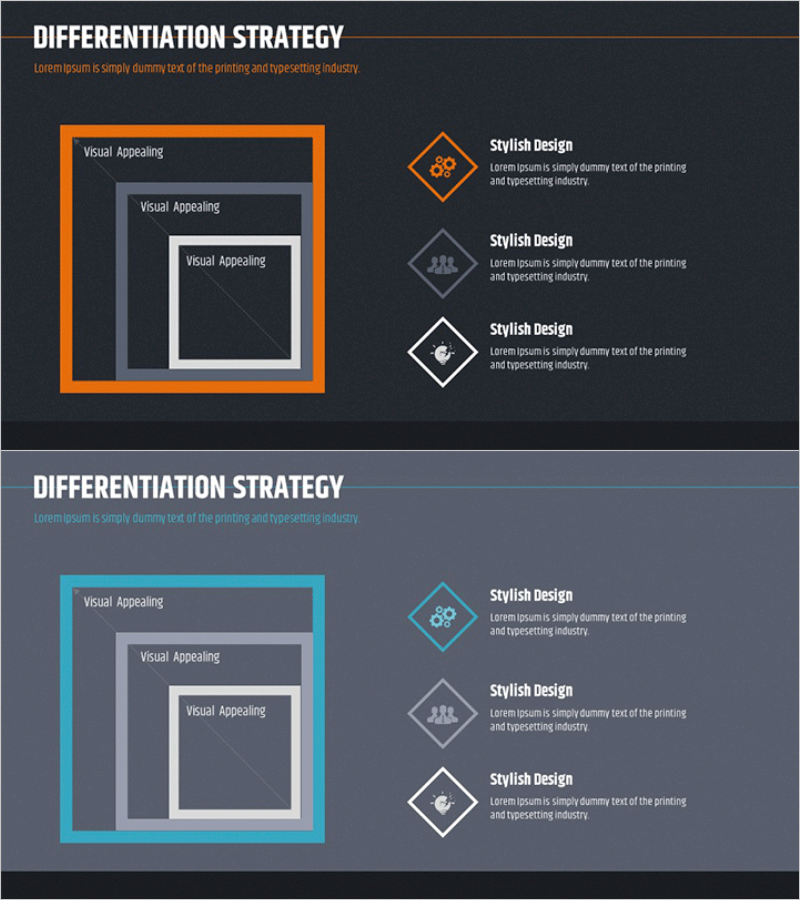
Product Service Differentiation Strategy Inclusion Diagram
#Product/Service #Marketing Plan and Strategy #Diagram
