Company Introduction
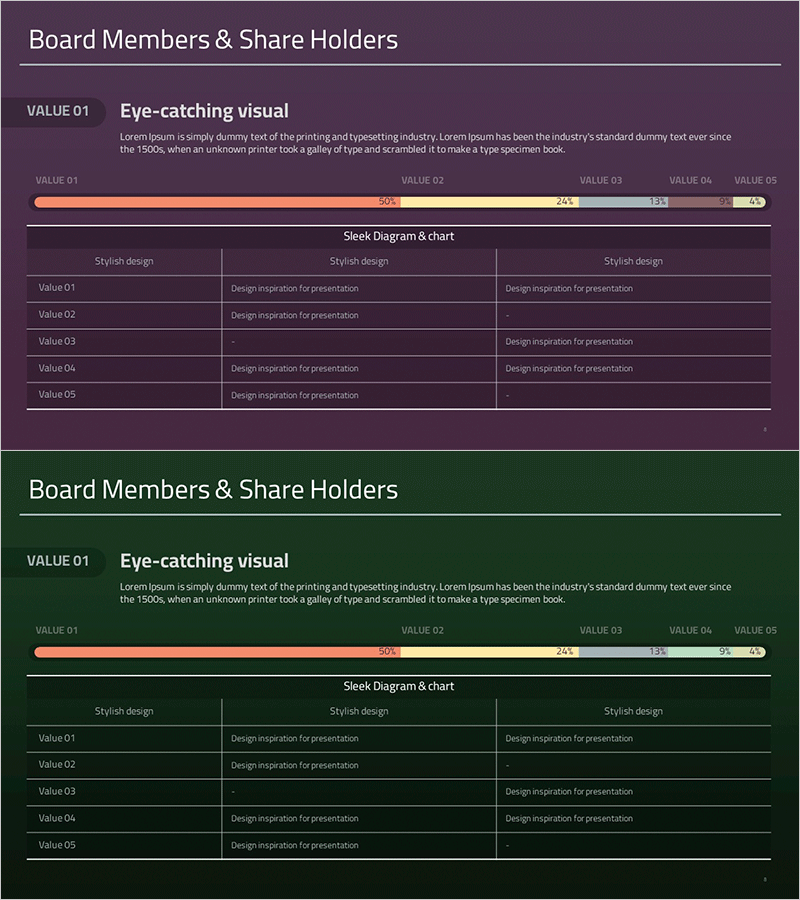
Shareholder Status Analysis Data Chart – Insights and Market Analysis
RM0300020_7
- Last Update 12/21/2025
- File Size 0.3MB
- # of Slides 2
- File Format PPTX
- Slide Ratio 16:9
- Color
Keywords
- #Content-Based Slides
- #Design-Based Slides
- #Company Introduction
- #Market and Competitor Analysis
- #Diagram
- #Graph
- #Shareholder Structure
- #Market Analysis
- #Table
- #Horizontal Bar
- #Standard Table
- #Segmented Horizontal Bar
- #16:9
- #Shareholder Status
- #Data Chart
- #Market Analysis
- #Graph
- #Diagram
- #Horizontal Bar
About the Product
This slide features a sleek data chart designed for visually analyzing shareholder status. The horizontal bar graph allows for easy understanding of each shareholder's proportion and composition. The design harmoniously uses purple and green colors to create a professional impression, while the organized table format ensures clear information delivery. It is optimized for presentations that require market analysis and competitive analysis, making it an essential tool for professionals in shareholder reports, corporate presentations, and strategic meetings. The editing difficulty is rated as 'moderate', allowing for easy adjustment of text and data.
Related Products
-
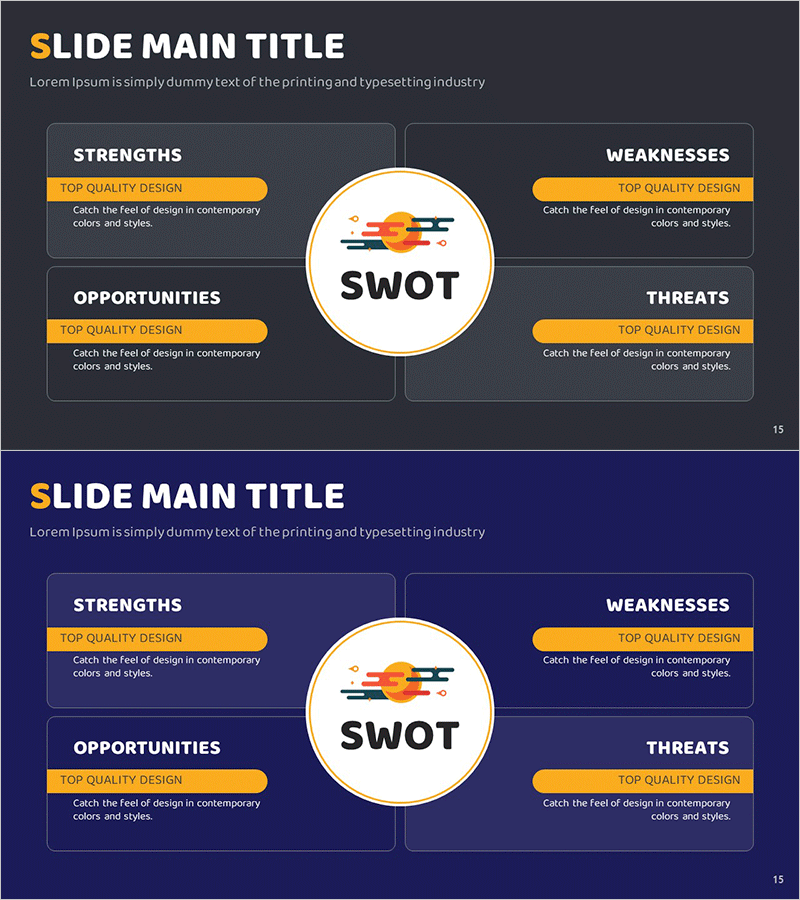
Space SWOT Analysis – Future Strategy Development
#Market and Competitor Analysis #Diagram #SWOT Analysis
-
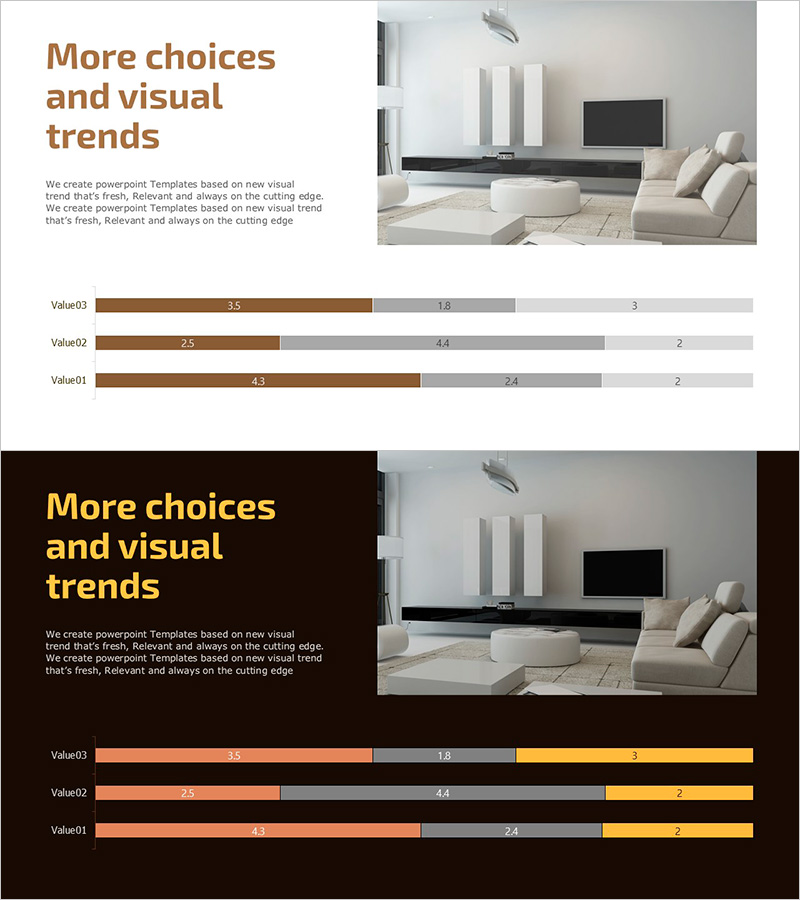
Quarterly Furniture Sales Figures Chart – Analysis and Performance
#Market and Competitor Analysis #Financial Plans and Performance #Graph
-
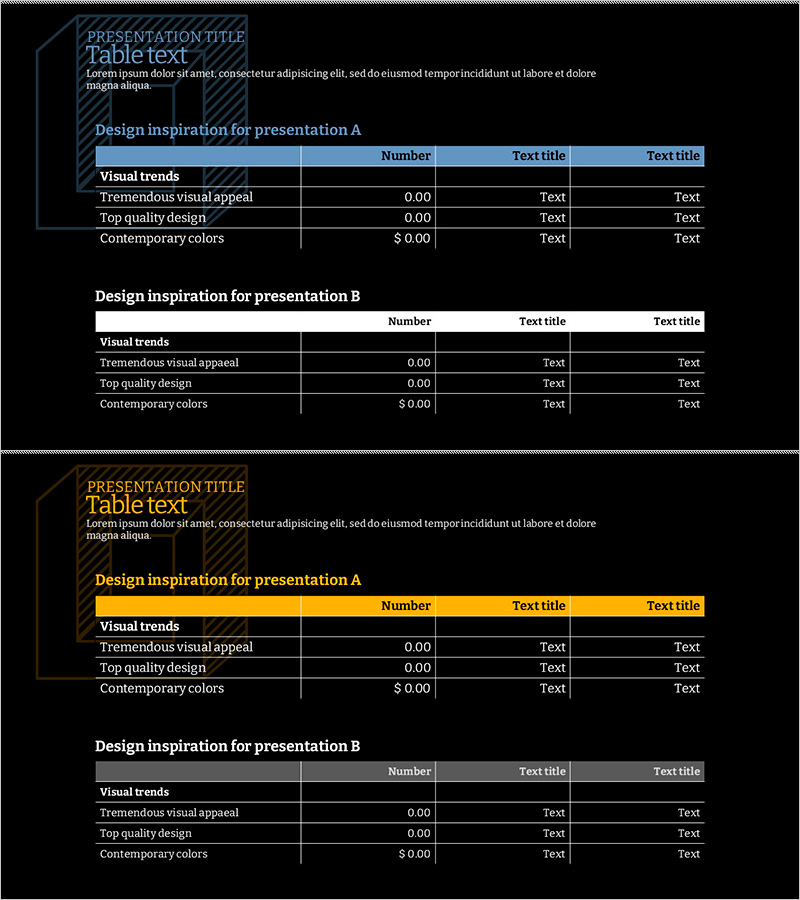
Two Simple Box Tables – A Practical Presentation Tool
#Diagram
-
Forward Progression Diagram – Visualizing Progress
#Diagram
