Company Introduction
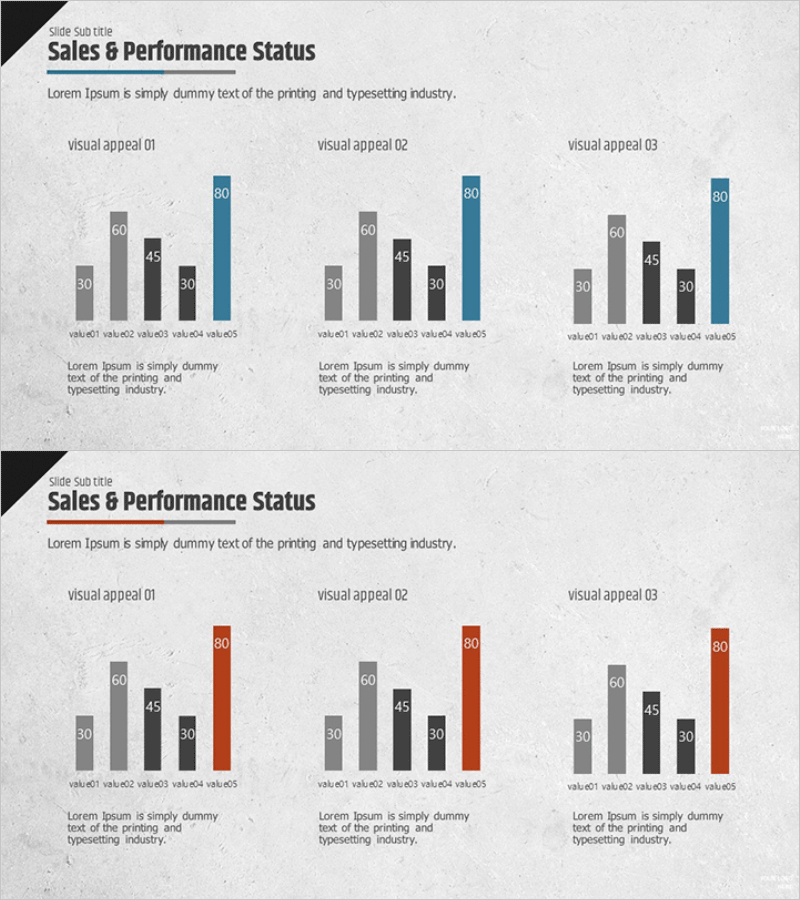
Key Performance Analysis Vertical Bar Chart – Emphasizing Analysis and Growth
RM0300002_17
- Last Update 12/21/2025
- File Size 4.2MB
- # of Slides 2
- File Format PPTX
- Slide Ratio 16:9
- Color
Keywords
About the Product
This slide utilizes a vertical bar chart to clearly visualize the key performances in analysis. Featuring a minimalist and modern design with a blue, red, and gray palette, it aids in easy understanding of data comparisons. The three visual appeal structures allow for diverse messaging capabilities. As a standard graph design, it has an easy editing structure, making it ideal for performance presentations, annual reports, or market analysis materials. Text and data replacements are straightforward, with the editing difficulty rated as 'easy' for quick insertion.
Related Products
-
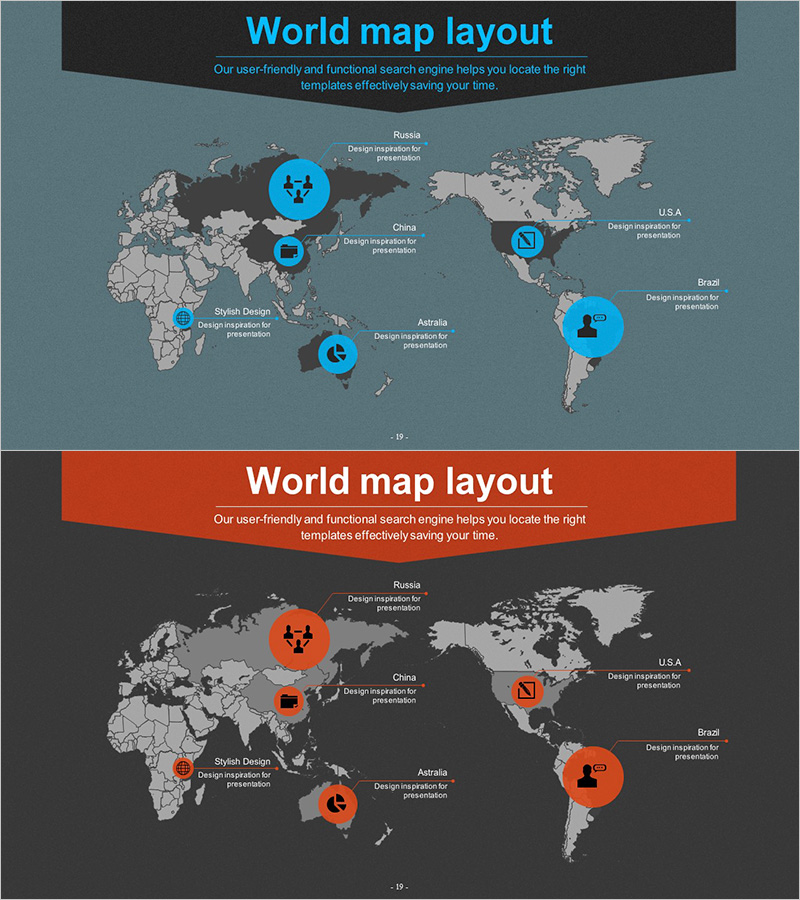
World Map Slide for Visualizing Global Target Countries
#Company Introduction #Marketing Plan and Strategy #Other
-
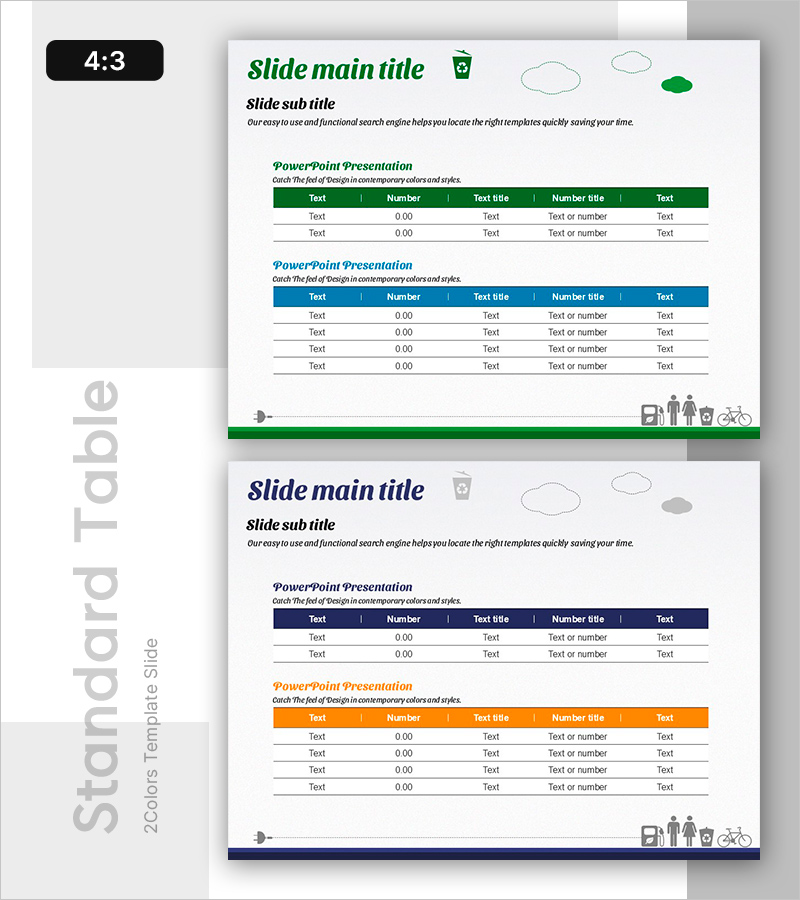
Summary Table of Energy Saving Outcomes
#Market and Competitor Analysis #Financial Plans and Performance #Diagram
-

Customer Analysis Slide for Tired Office Workers - Market and Risk Management Strategy
#Market and Competitor Analysis #Risk Management and Regulatory Compliance #Customer Analysis
-
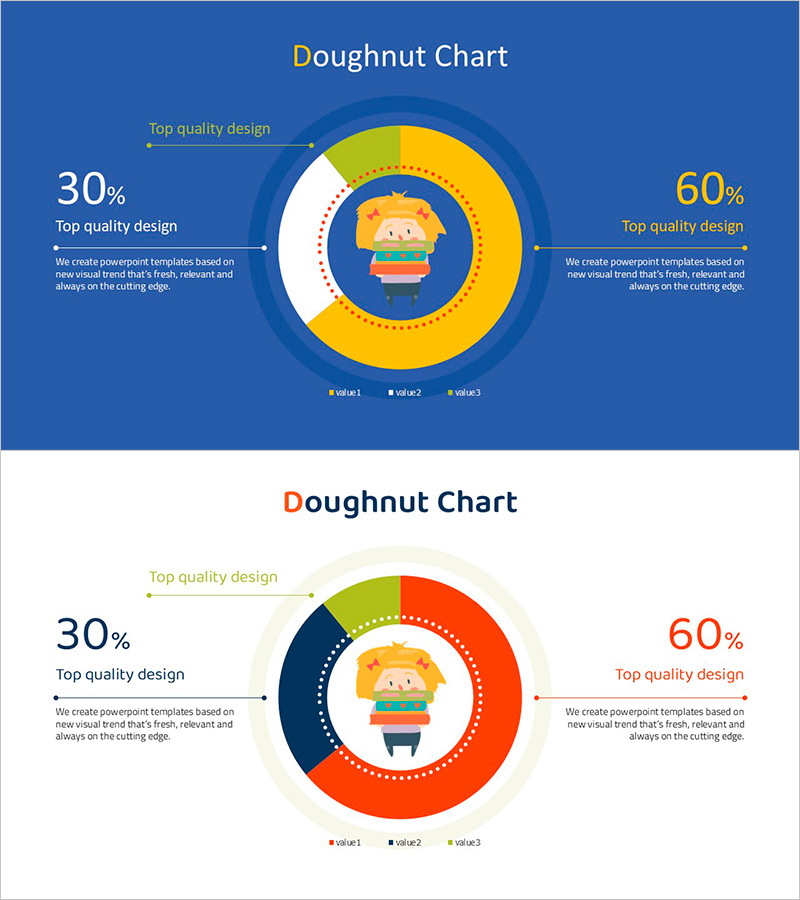
Doughnut Chart Data Visualization Slide – Top Quality Design
#Graph #Market Share #Circles
