Technology Sector
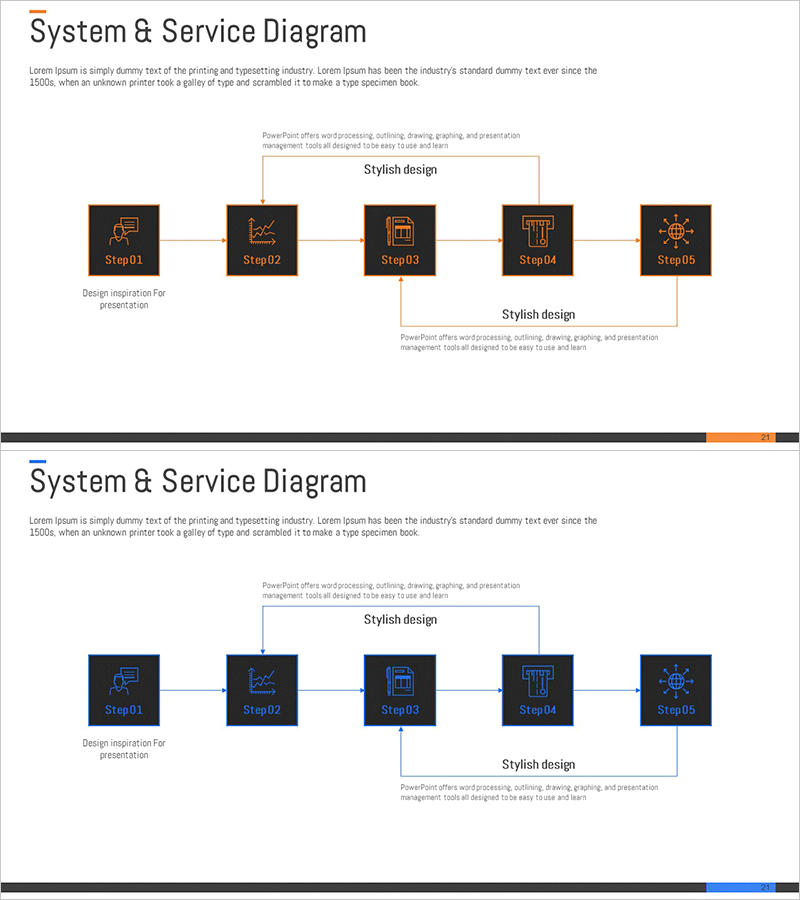
Securities Service System Structure – Systematic Flow Diagram
RM0200004_20
- Last Update 12/21/2025
- File Size 0.2MB
- # of Slides 2
- File Format PPTX
- Slide Ratio 16:9
- Color
Keywords
About the Product
This slide presents a diagram clearly illustrating the structure of the securities service system. With a sharp contrast of orange and blue colors, it visually conveys the service process across various stages (from Step 1 to Step 5). Each stage is distinctly separated by clear icons and text explanations, making it ideal for presentations related to the technical sector or service composition. It is highly beneficial for technical users such as engineers and IT professionals, and the text and icon elements are easily editable, making the editing difficulty level rated as 'easy'.
Related Products
-
Strategic Execution Options – Execution Options Diagram
#Product/Service #Diagram #Composition
-
Overseas Marketing Strategy Slide – Diagram for Effective Business Implementation
#Business Promotion Strategy #Marketing Plan and Strategy #Diagram
-

Circle Puzzle Connected Diagram for Operational Planning – Efficient Service Execution
#Operation Plan #Technology Sector #Diagram
-
Core Competency Analysis Diagram – Structural and Cluster-based
#Product/Service #Business Vision and Strategy #Diagram
