Core Competency Analysis Diagram – Structural and Cluster-based
RM0200016_10
- Last Update 02/05/2025
- File Size 0.3MB
- # of Slides 2
- File Format PPTX
- Slide Ratio 16:9
- Color
Keywords
- #Content-Based Slides
- #Design-Based Slides
- #Product/Service Introduction
- #Business Vision and Strategy
- #Diagram
- #Features
- #Core Competencies
- #Structure
- #Cluster
- #Tree Diagram
- #Chain Diagram
- #16:9
- #cluster diagram PowerPoint
- #core competency analysis slide
- #connected diagram template
- #organizational structure diagram
- #central node PowerPoint slide design
About the Product
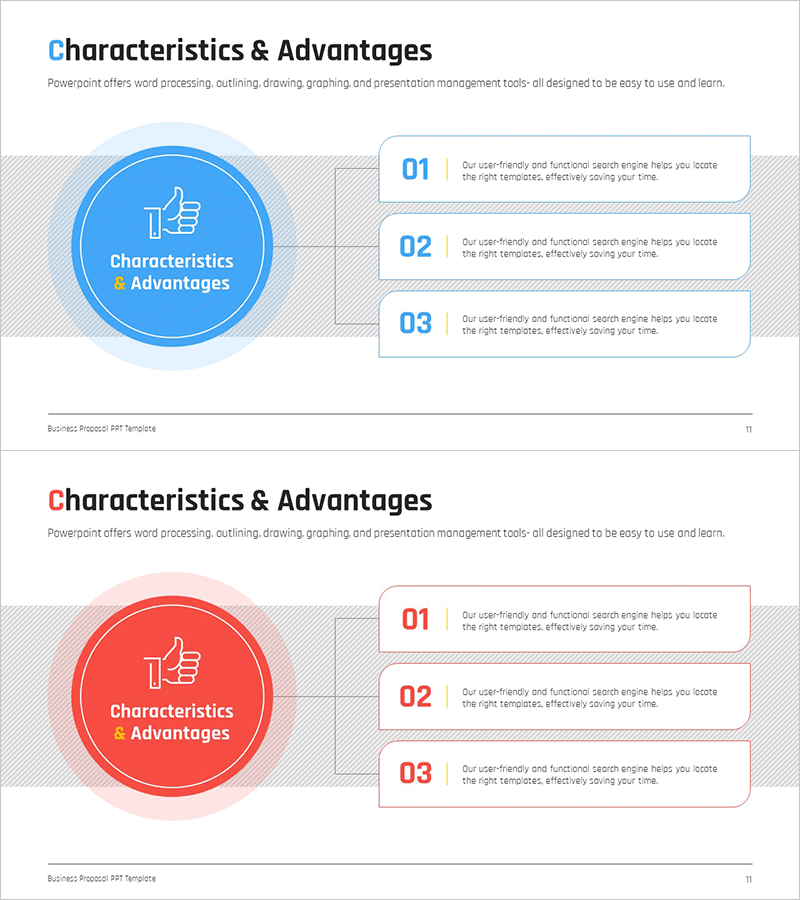
A cluster-based diagram PowerPoint slide designed for core competency analysis and organizational mapping. The structure features a central circular node with three connected areas radiating outward, visually representing relationships between key elements and supporting factors. Available in two color versions—blue and red—with fully editable text boxes and connector lines for each section. This presentation template is ready to use for strategy presentations, organizational analysis, capability assessments, and stakeholder communications.
Usage Points
-
Main Usage
Visualize hierarchical relationships between core competencies and related organizational elements. The central node serves as the primary concept, with three surrounding areas representing supporting factors, enabling clear communication of strategic interconnections during executive presentations.
-
How to Use
Enter your core concept in the central circular node, then populate the surrounding text boxes with specific competencies or strategic elements. Choose between the blue or red color version based on your presentation theme and corporate branding guidelines.
-
Recommended For
Strategy planning teams, HR and organizational development professionals, executive report writers, management consultants, and business analysts presenting competency frameworks, organizational structures, or strategic capability assessments.
-
Slide Structure
Two-slide set, each featuring one central circular node with three connected areas (two on one side, one on the other, or vice versa). Connector lines establish visual relationships between the central element and surrounding areas. All text fields are fully editable and customizable.
Related Products
-

Exercise Equipment and Infographic Elements – Innovative Business Strategy
#Business Vision and Strategy #Technical Approach #Diagram
-

Core Technology Characteristics Diagram – Strategic Analysis
#Product/Service Introduction #Business Vision and Strategy #Diagram
-

Core Competency Simple Diagram – Strategic Insights in Clusters
#Product/Service Introduction #Business Vision and Strategy #Diagram
-

Key Feature Analysis Diagram
#Product/Service Introduction #Business Vision and Strategy #Diagram
