Financial Plans and Performance
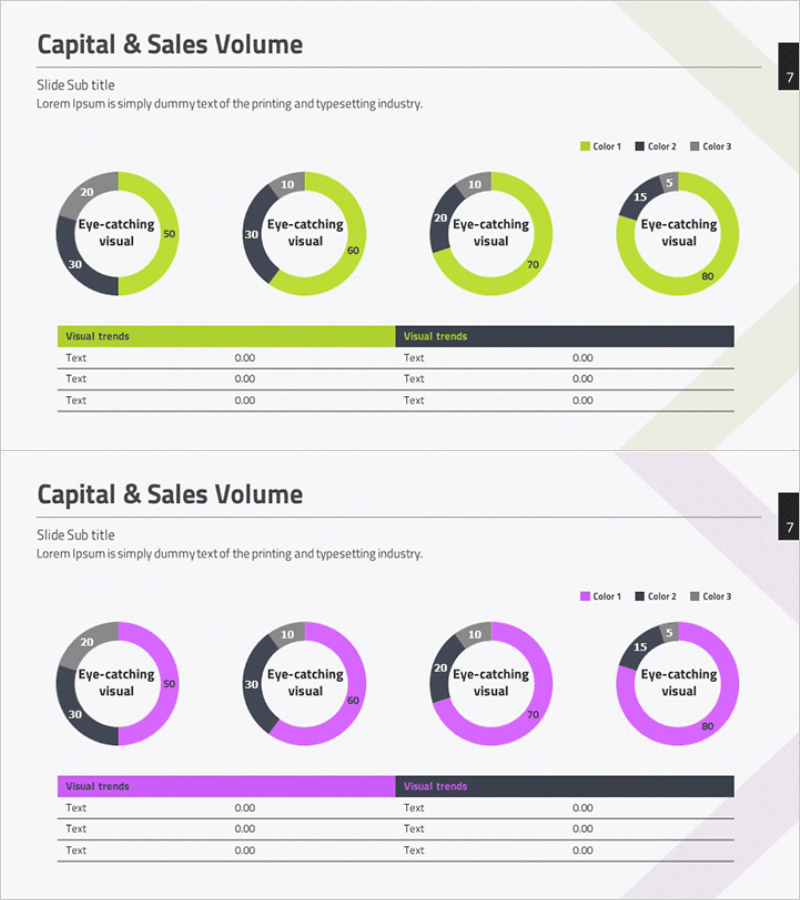
Capital Sales Analysis Graph – Visualizing Financial Performance
RM0200001_6
- Last Update 12/21/2025
- File Size 3.5MB
- # of Slides 2
- File Format PPTX
- Slide Ratio 16:9
- Color
Keywords
About the Product
This slide features a capital sales analysis graph designed to effectively present various performance indicators. Utilizing pie charts, it visually organizes sales and revenue data, while offering a harmonious blend of green and purple tones that convey stability and sophistication. Users can easily communicate their objectives and achievements in various contexts, such as business proposals or investment reports. The text and data fields are easily replaceable, with an overall editing difficulty rated as 'easy', allowing for quick modifications.
Related Products
-
Weather Status Analysis Graph
#Business Promotion Strategy #Market and Competitor Analysis #Diagram
-
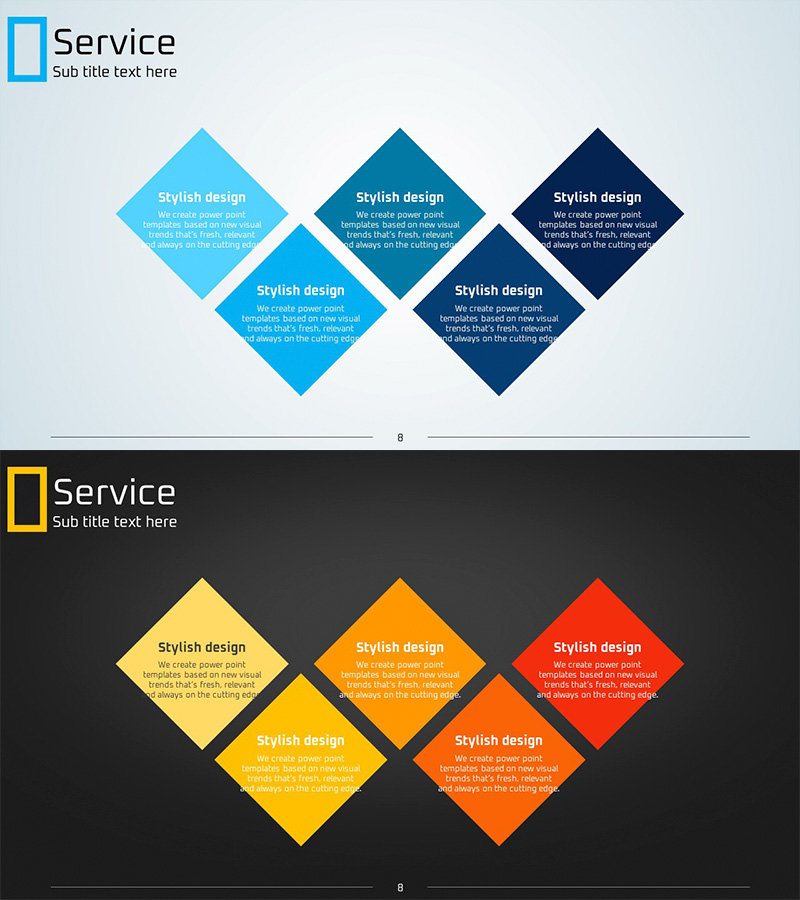
Service Diagram – Product and Service Introduction
#Product/Service #Business Vision and Strategy #Diagram
-

Core Medical Personnel Introduction – Highlighting Team Expertise Slide
#Company Introduction #Diagram #Text Box
-

Business Plan Presentation Template Sequence Diagram – Effective Operations Slide
#Business Management #Operation Plan #Diagram
