Business Plan Presentation Template Sequence Diagram – Effective Operations Slide
RJ0200027_32
- Last Update 04/05/2025
- File Size 1.9MB
- # of Slides 2
- File Format PPTX
- Slide Ratio 16:9
- Color
Keywords
- #Content-Based Slides
- #Design-Based Slides
- #Business Management
- #Operational Plan
- #Diagram
- #Text Box
- #Reporting and Review Plan
- #Business Processes
- #Spread
- #Radial Diagram
- #Sticky Note
- #16:9
- #3-step diagram PowerPoint
- #connected diagram presentation
- #business plan slide
- #operations flow diagram
- #PowerPoint diagram slide
- #process flow template
About the Product
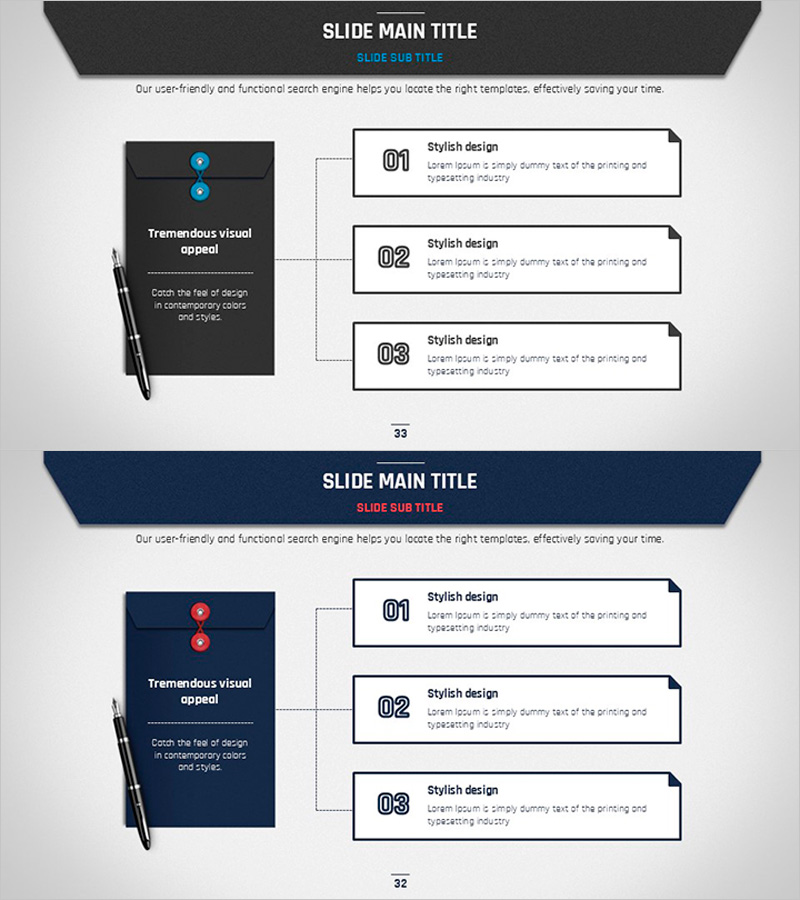
A 3-step connected diagram PowerPoint slide optimized for business plan presentations. The design features a dark background with bright accent colors (blue and red) in circular nodes, clearly expressing sequential processes and operational stages. Provided in 16:9 widescreen format with 2 slides, each with ample text areas for stage-specific descriptions. Ideal for corporate presentations, executive reports, and business strategy decks. The circular node structure with connecting lines enables effective communication of strategic planning, execution roadmaps, and performance management workflows. Ready to edit and customize for immediate use in professional presentations.
Usage Points
-
Main Usage
Designed to visualize sequential operational stages in business planning. Represents three key processes—strategic planning phase, execution phase, and performance management phase—using circular nodes and connecting lines, enabling clear communication of operational flow to executives and team members.
-
How to Use
Enter core keywords in each circular node and detailed descriptions in the right text boxes. Summarize the overall operational direction in the left dark panel, and fill in stage-specific objectives, actions, and expected outcomes in the three right boxes for strategy presentations.
-
Recommended For
Recommended for business plan presentations, executive reports, organizational operations planning, project kickoff meetings, and strategy workshops. Ideal for executives, planning teams, and project leaders explaining operational workflows.
-
Slide Structure
2-slide layout. Each slide features a left dark panel (title and descriptive text) and a right 3-step connected diagram (3 circular nodes + connecting lines + 3 text boxes). First slide uses dark gray background; second slide uses dark blue for visual variety.
Related Products
-

Contents Slide of Educational Content
#Product/Service Introduction #Business Management #Diagram
-

Circular Gradient Wide Template Icons&Text
#Business Management #Operational Plan #Reporting and Review Plan
-

Visualizing Work Process with Geometric Pattern Wide Diagram
#Product/Service Introduction #Operational Plan #Diagram
-

Visualizing Operational Plans with Triangle Pattern – Simple Yet Powerful Information Delivery
#Business Management #Operational Plan #Reporting and Review Plan
