Market and Competitor Analysis
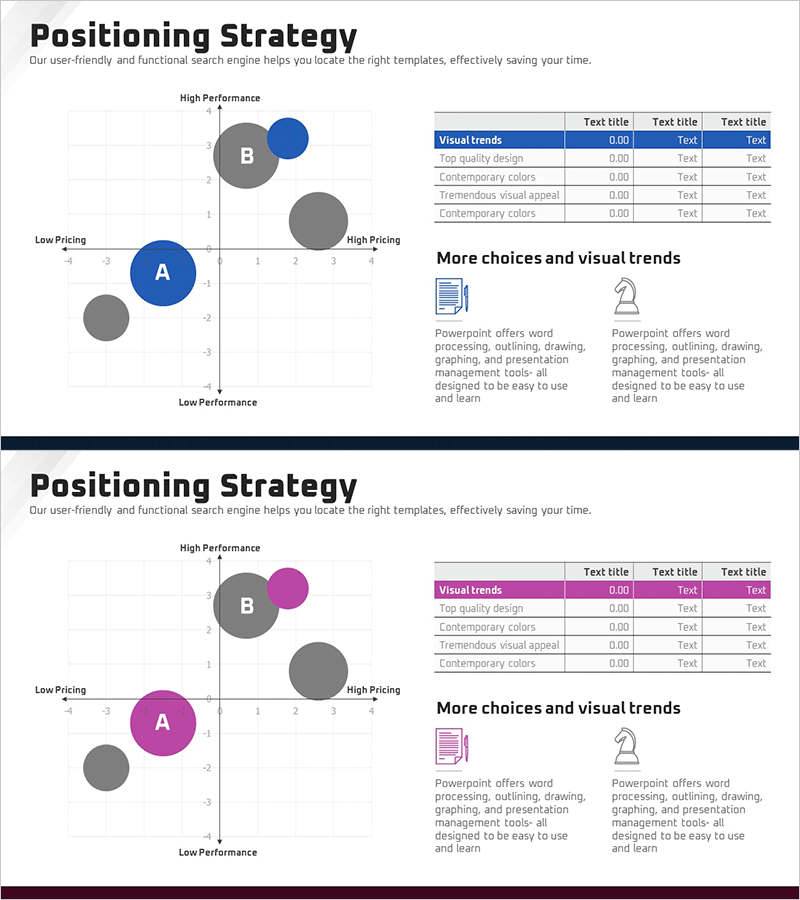
Positioning Point Area Graph – Strategy for Market Analysis
RM0100011_25
- Last Update 12/21/2025
- File Size 1MB
- # of Slides 2
- File Format PPTX
- Slide Ratio 16:9
- Color
Keywords
About the Product
This slide utilizes a positioning point area graph to visually convey the competitive positioning in the market. The graph indicates the position of points based on performance and price, making it useful for effectively communicating product or service positioning strategies. The harmonious blue and purple color scheme enhances a professional image, with a layout that distinctly separates the title and data areas. Ideal for discussions on marketing plans and strategies, as well as competitive analysis presentations. It's easy to replace text and graph structures, with an editing difficulty rated as 'easy'.
Related Products
-
Establishing Vision for Finance Evolution - In a Changing Financial Landscape
#Product/Service #Operation Plan #Diagram
-

Diagram of Medication Dosage by Body Type – Providing Pharmaceutical Information
#Business Introduction #Business Vision and Strategy #Diagram
-
Business Area Round Square Diagram – Business Introduction
#Product/Service #Business Introduction #Diagram
-

Competitor Website Analysis Graph – Market and Competitor Analysis
#Market and Competitor Analysis #Graph #Competitor Analysis
