Market and Competitor Analysis
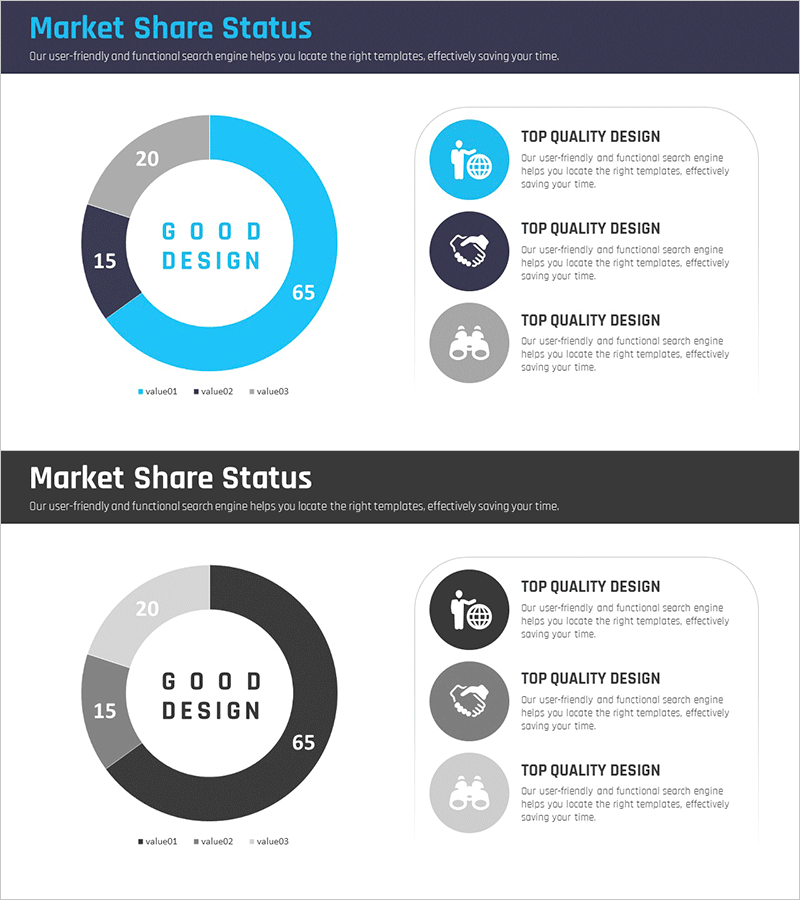
Market Share Analysis Graph by Technology – Competition and Collaboration
RM0100006_11
- Last Update 12/21/2025
- File Size 0.3MB
- # of Slides 2
- File Format PPTX
- Slide Ratio 16:9
- Color
Keywords
About the Product
This PowerPoint slide utilizes a donut chart to visually analyze market shares by technology, effectively aiding in information delivery. By representing each technology's share intuitively, it enhances understanding of the data, while the balanced color scheme of gray and blue emphasizes professionalism. This slide is essential for various business situations such as market analysis reports, proposals, and strategic planning documents. Editing is also simple, allowing for easy substitution with desired data, rated as 'easy' in terms of difficulty.
Related Products
-
Medical Core Field Description Diagram – Capturing Vision and Strategy
#Company Introduction #Business Vision and Strategy #Diagram
-
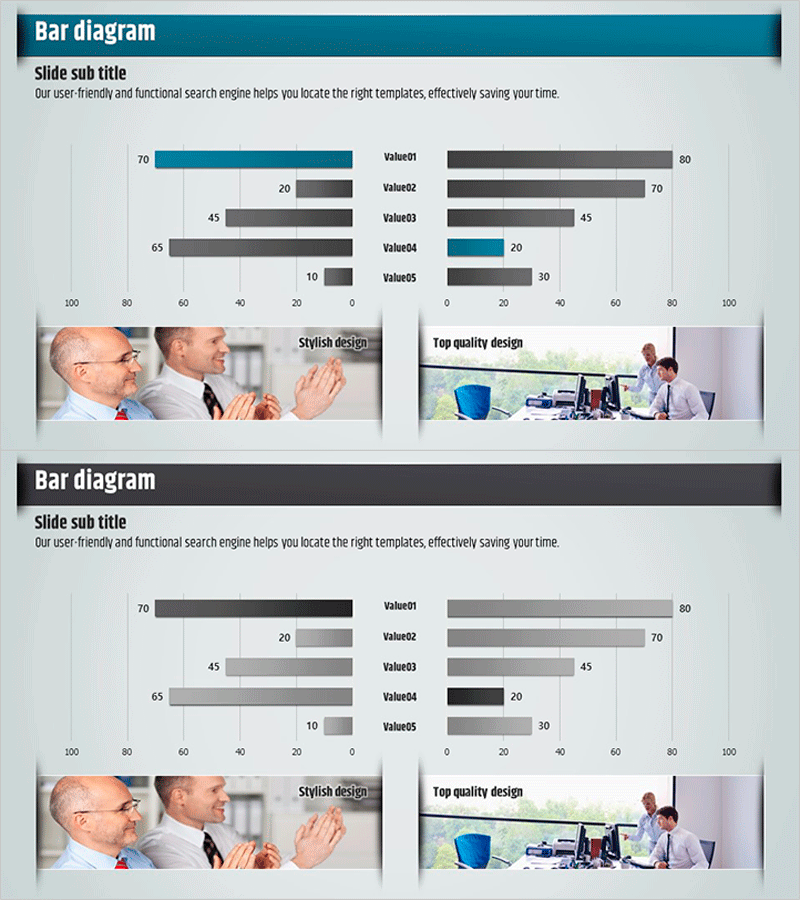
Idea Derivation Template – Bilateral Bar Graph
#Market and Competitor Analysis #Graph #Market Status
-
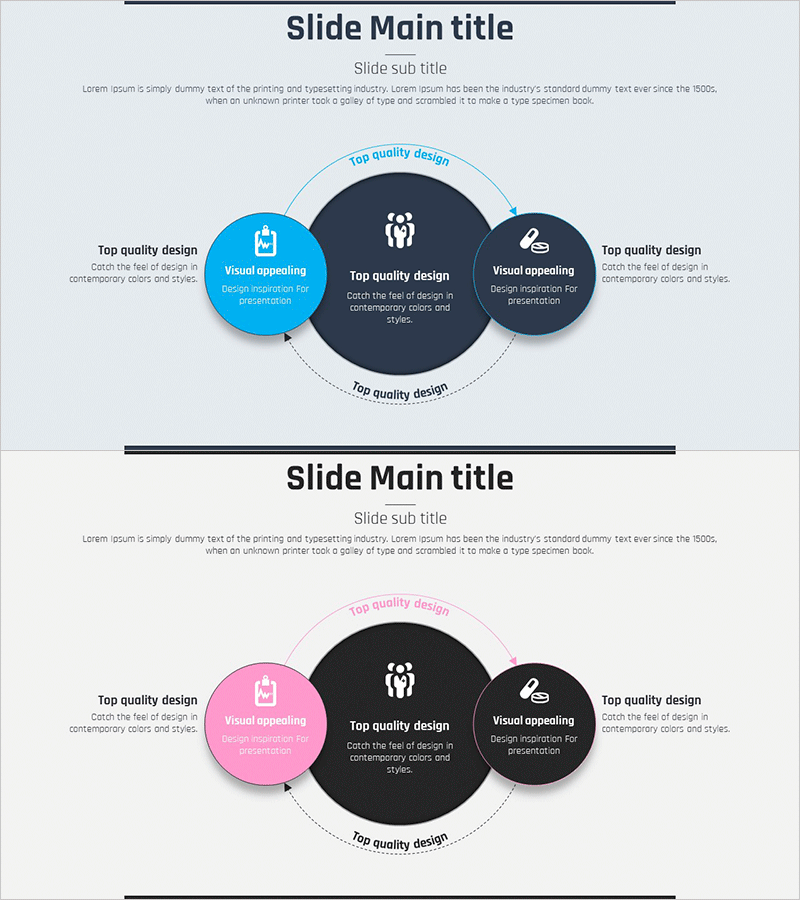
Operational Breakdown in Donut Chart – Innovative Data Visualization
#Product/Service #Technology Sector #Graph
-

Stylized Organization Chart for Fountain Pen Company
#Company Introduction #Diagram #Manpower
