Graph
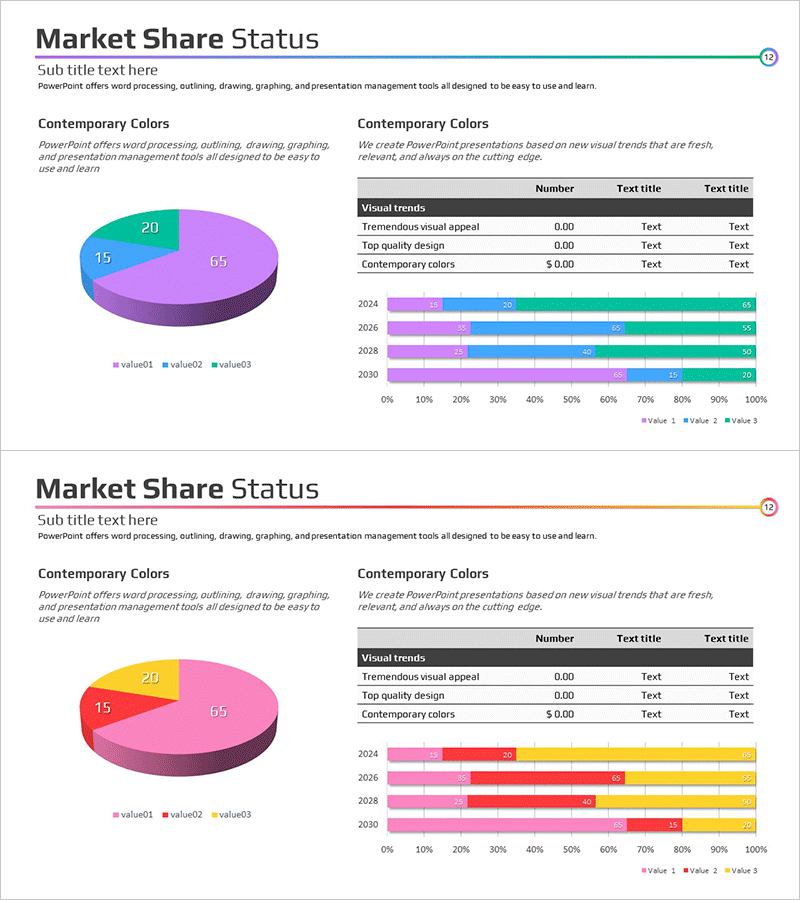
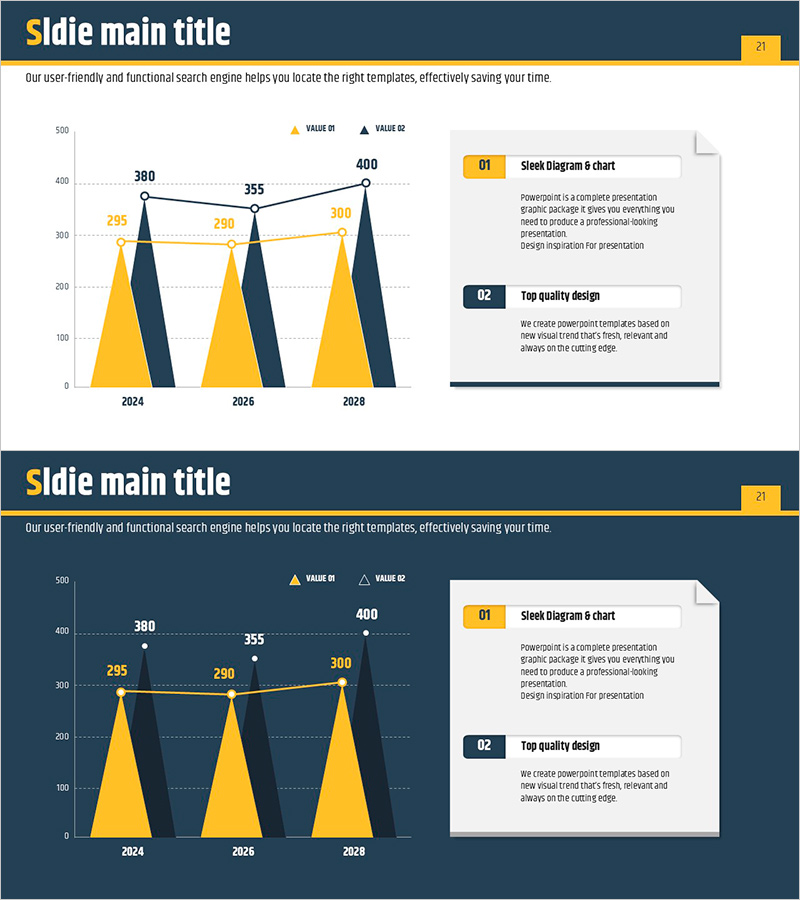
Visualizing Market Analysis Status with Charts
RM0100005_11
- Last Update 12/21/2025
- File Size 0.3MB
- # of Slides 2
- File Format PPTX
- Slide Ratio 16:9
- Color
About the Product
This slide utilizes market analysis charts to intuitively showcase current market share and trends. Featuring pie and bar graphs for visual data comparison, it stands out with a contemporary color palette of green and red. Ideal for conveying clear insights in executive reports or investment proposals.
Related Products
-
Yellow Blue Future Outlook Graph
#Market and Competitor Analysis #Graph #Future Outlook
-
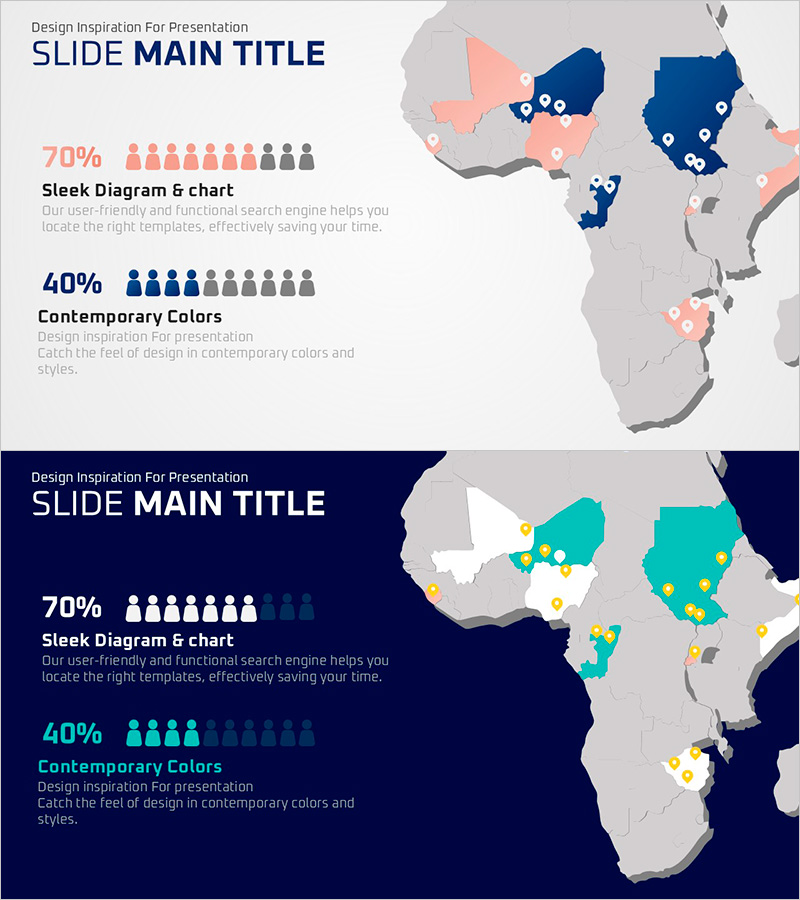
Detailed Customer Analysis by Region – Data Visualization Slide
#Market and Competitor Analysis #Graph #Other
-
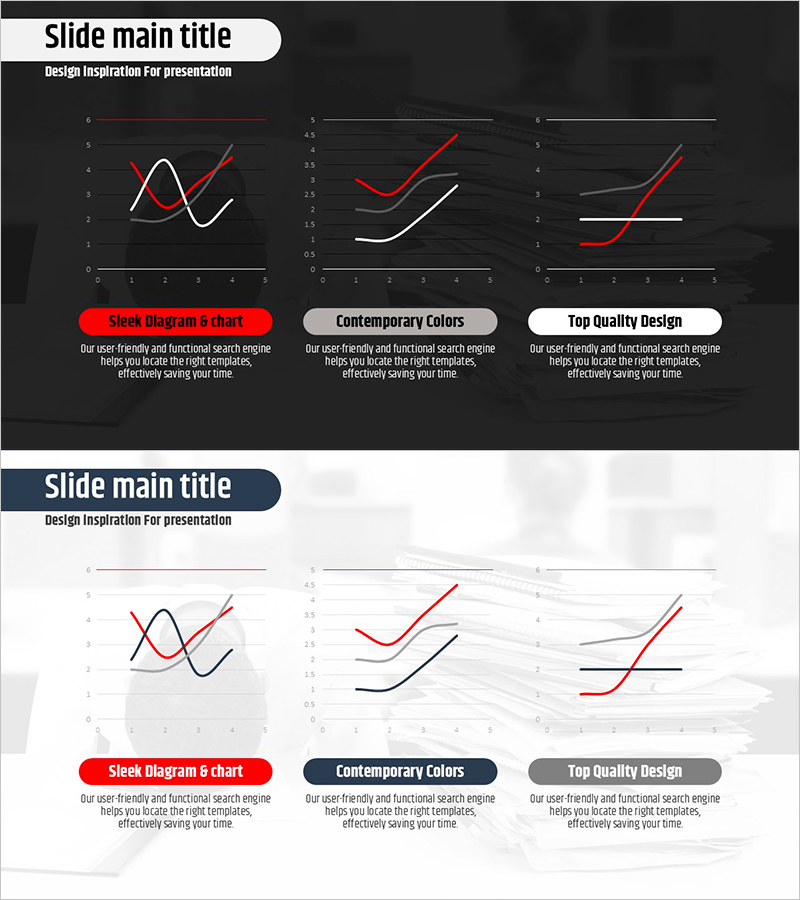
Work Stress Visualized with Line Chart – Analysis and Competitive Advantage
#Market and Competitor Analysis #Graph #Market Status
-
Navy Yellow Mixed Charts and Analysis – Market and Competitive Analysis
#Business Introduction #Market and Competitor Analysis #Graph
