Financial Plans and Performance
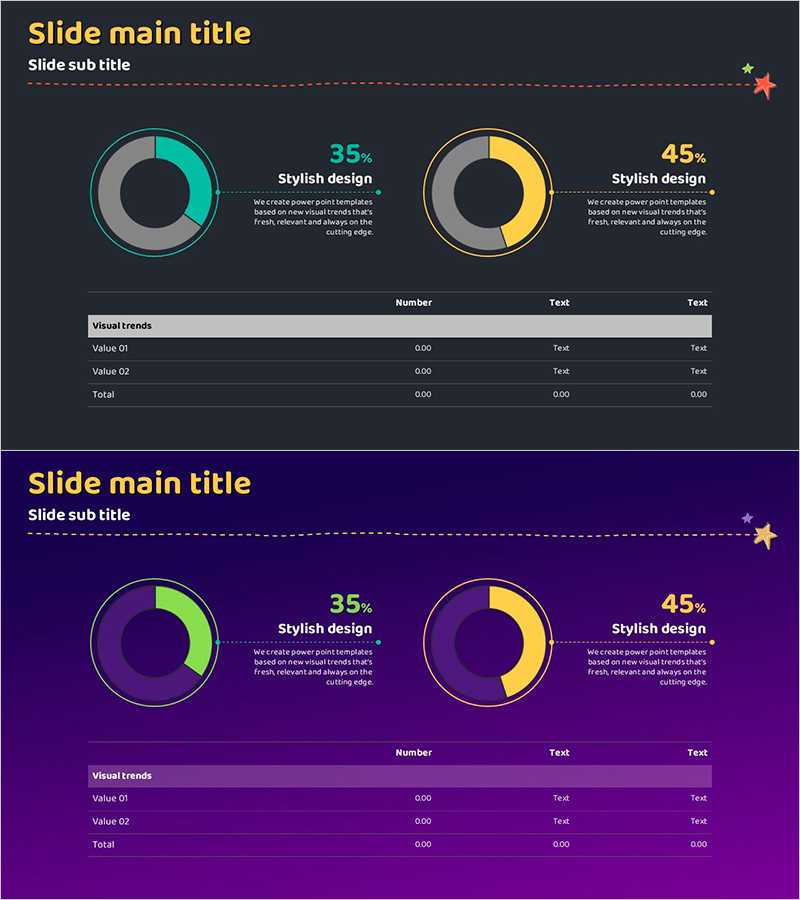
Donut Chart Analysis and Table – Simple Data Visualization
RJ0800001_9
- Last Update 12/21/2025
- File Size 0.4MB
- # of Slides 2
- File Format PPTX
- Slide Ratio 16:9
- Color
Keywords
About the Product
This slide uses a donut chart to visually analyze data, providing easy-to-understand information. The table format complements the data to facilitate comparison and analysis, capturing the audience's attention with a distinct color scheme. The use of yellow and green conveys trust and liveliness, making it ideal for data visualization and analytical reports. It is applicable in various industries and features an easy-to-edit structure, perfect for immediate practical application.
Related Products
-
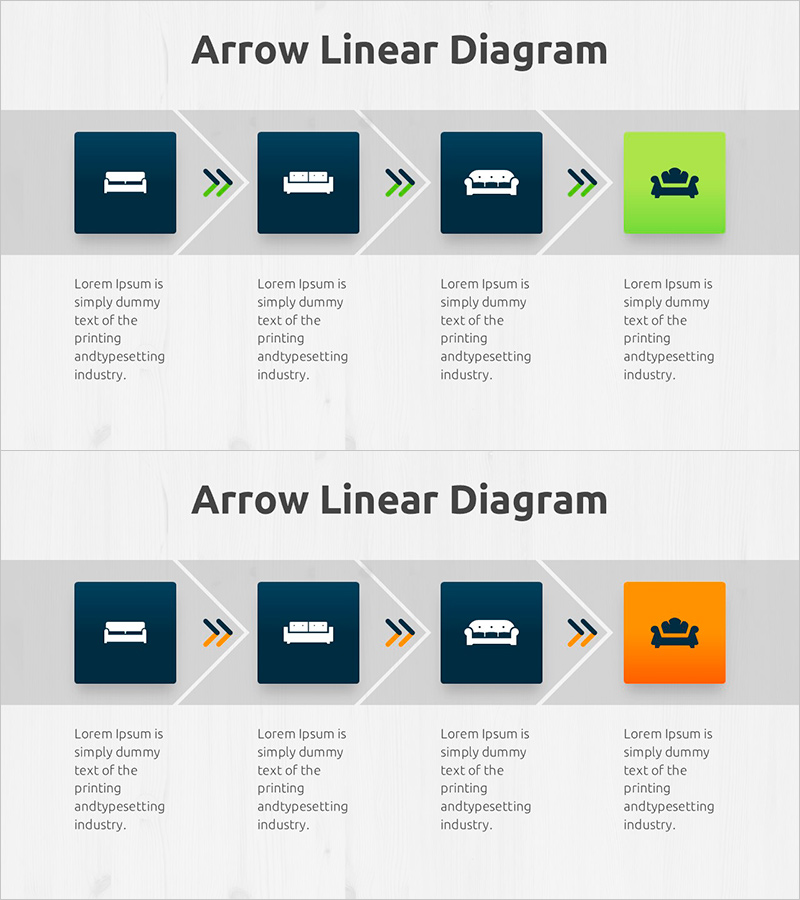
Understanding Differences by Sofa Cushion Types – Arrow Linear Diagram
#Product/Service #Technology Sector #Diagram
-
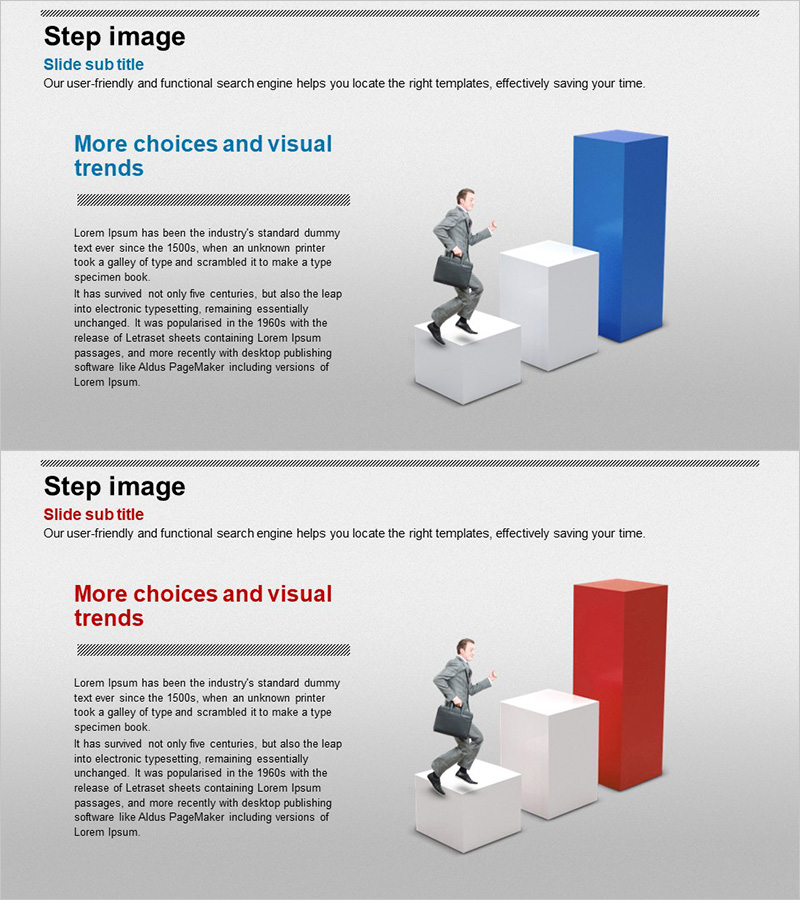
Business Objectives Description Slide – Business Goals and Growth Strategy
#Business Vision and Strategy #Marketing Plan and Strategy #Diagram
-
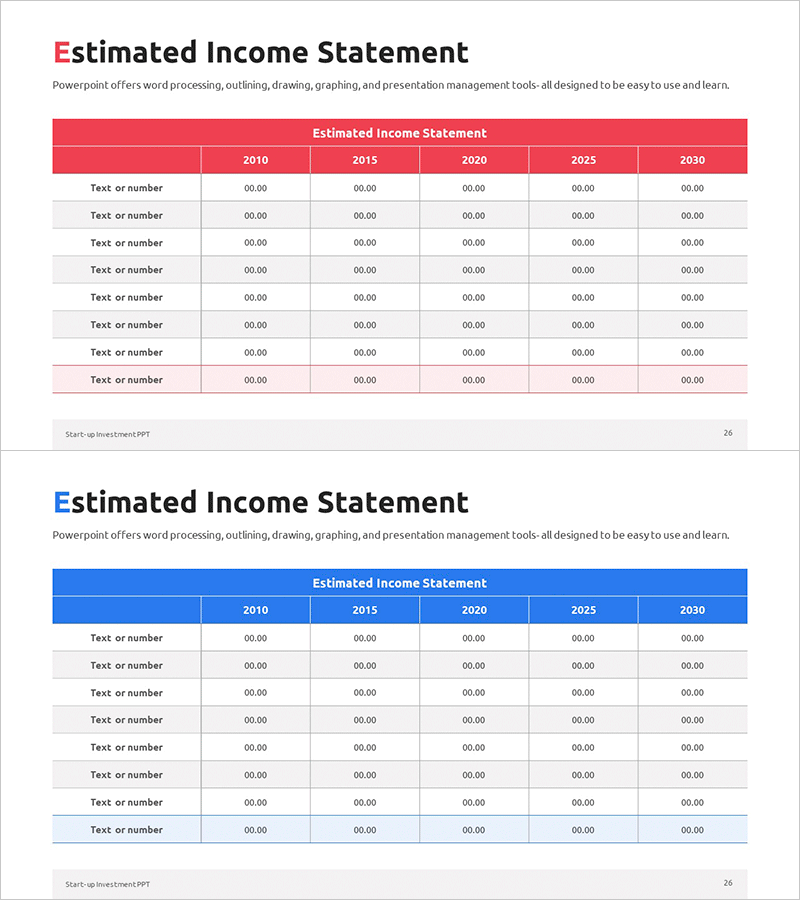
Year-by-Year Income Statement Chart – Financial Performance Analysis
#Financial Plans and Performance #Diagram #Income Statement
-

Detailed Description of Automotive Parts – Innovative Design
#Product/Service #Diagram #Product/Service Introduction
