Company Introduction
Experimental Area Description Slide - Analysis and Visualization
RJ0700019_25
- Last Update 12/21/2025
- File Size 1MB
- # of Slides 2
- File Format PPTX
- Slide Ratio 16:9
- Color
Keywords
About the Product
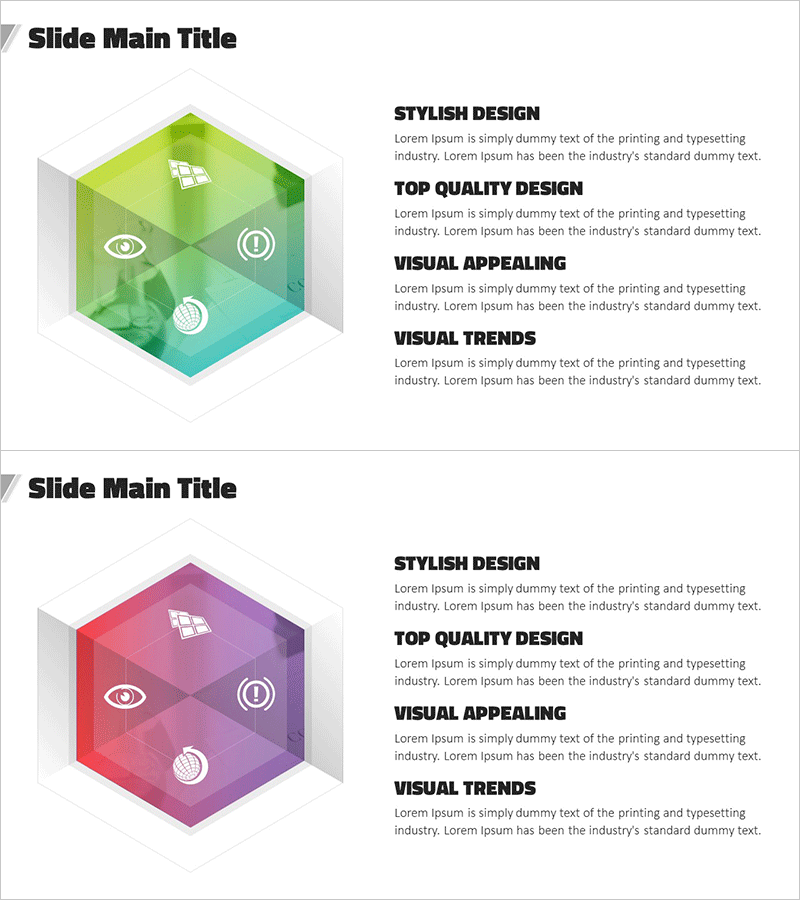
This slide is designed around a diagram to clearly describe the experimental area. Using a decentralized structure, it effectively visualizes complex relationships in experiments while maintaining readability. The design emphasizes a modern and sophisticated feel with blue and purple as the main colors, and text boxes and icons are harmoniously placed. This slide is suitable for introducing experimental-related businesses or data analysis materials, particularly for research and development teams or startup presentations where strong visual impact is required. Text modifications are easy, and the editing difficulty is rated as 'easy', allowing for seamless integration into various presentations.
Related Products
-
Final Business Goal Diagram – Connecting Strategy and Vision
#Business Vision and Strategy #Marketing Plan and Strategy #Diagram
-

Her Management Philosophy – A Presentation of Success
#Company Introduction #Customer Success Stories #Introduction of Executives
-

Team Organization Chart Profile – Structure and Harmony
#Company Introduction #Diagram #Manpower
-
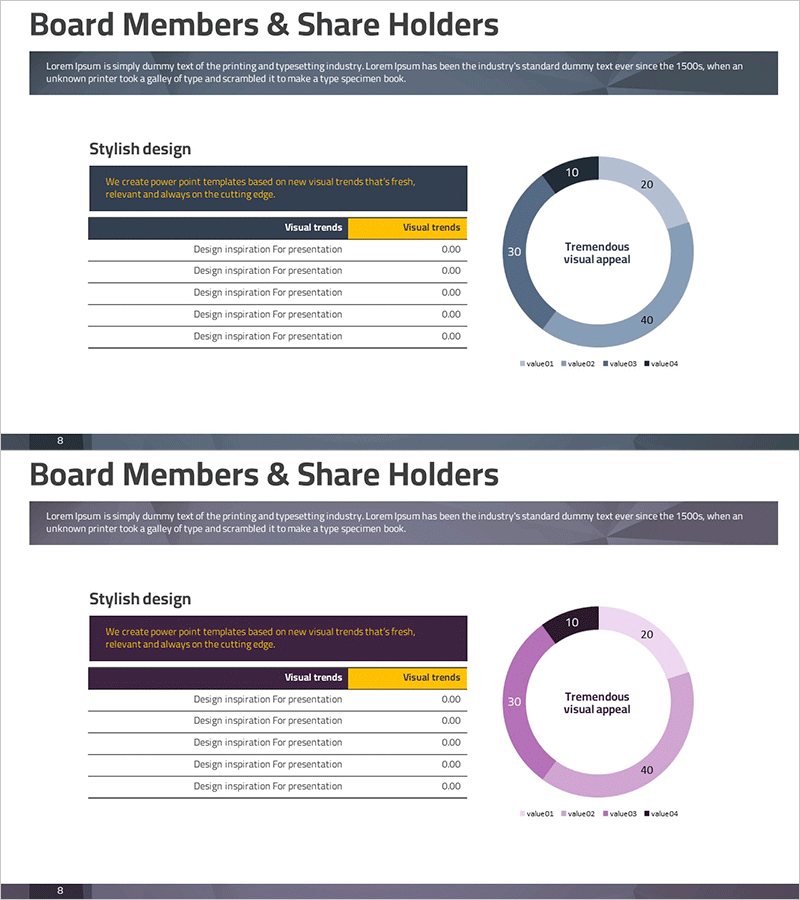
Status Analysis Donut Chart – Visualizing Market and Shareholder Status
#Company Introduction #Market and Competitor Analysis #Diagram
