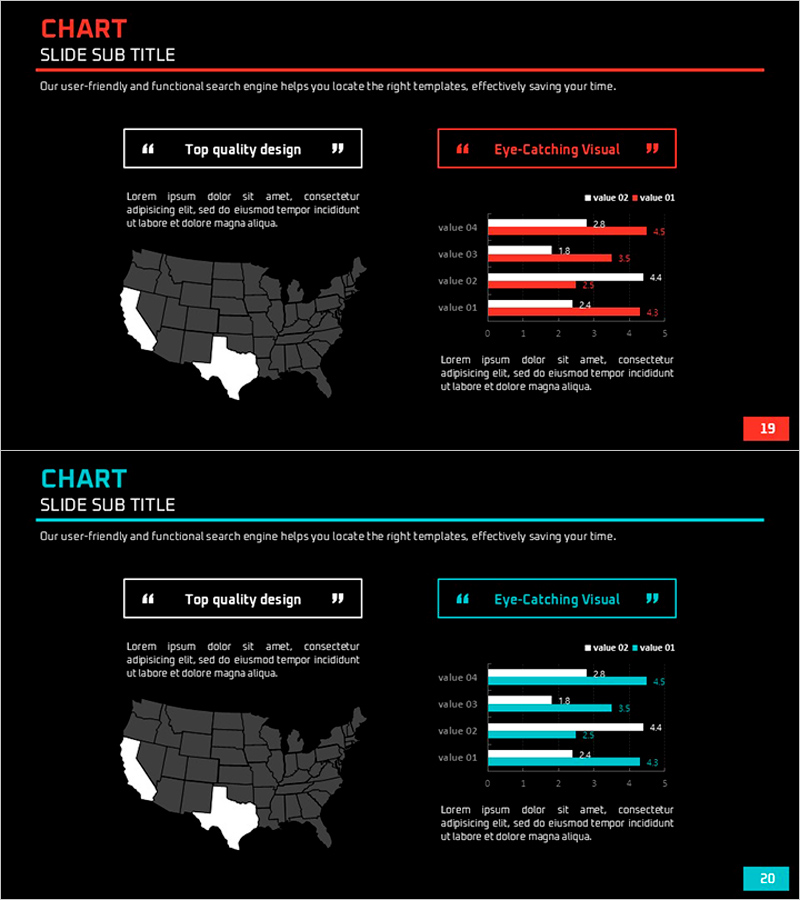
Market and Competitor Analysis
Regional Demand Comparison Graph
RJ0600065_19
- Last Update 12/21/2025
- File Size 1.1MB
- # of Slides 2
- File Format PPTX
- Slide Ratio 16:9
- Color
Keywords
About the Product
This slide presents a horizontal bar graph that compares regional demand. It is suitable for market analysis and competitor evaluations, facilitating clear communication of information to the audience. The use of red and cyan emphasizes data points, effectively visualizing demand per region. This slide can be easily adapted for presentations, reports, and proposals, allowing for quick data replacement with minimal editing difficulty, rated as 'easy'.
Related Products
-
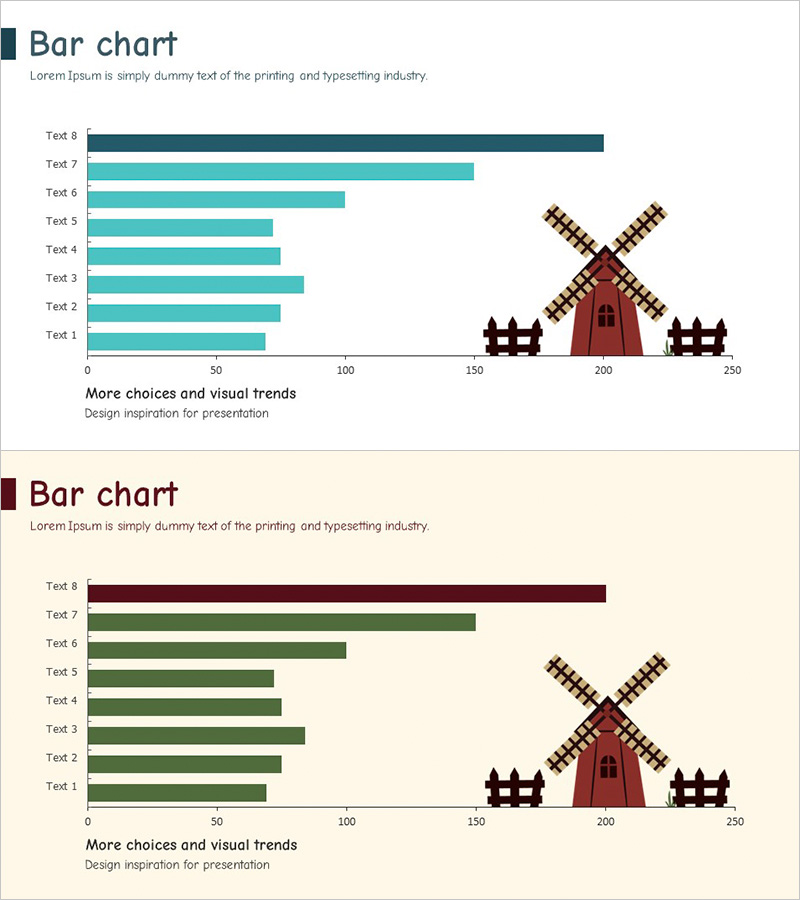
Farm Bar Graph for Market Analysis – Formulating Effective Business Strategies
#Business Promotion Strategy #Market and Competitor Analysis #Graph
-
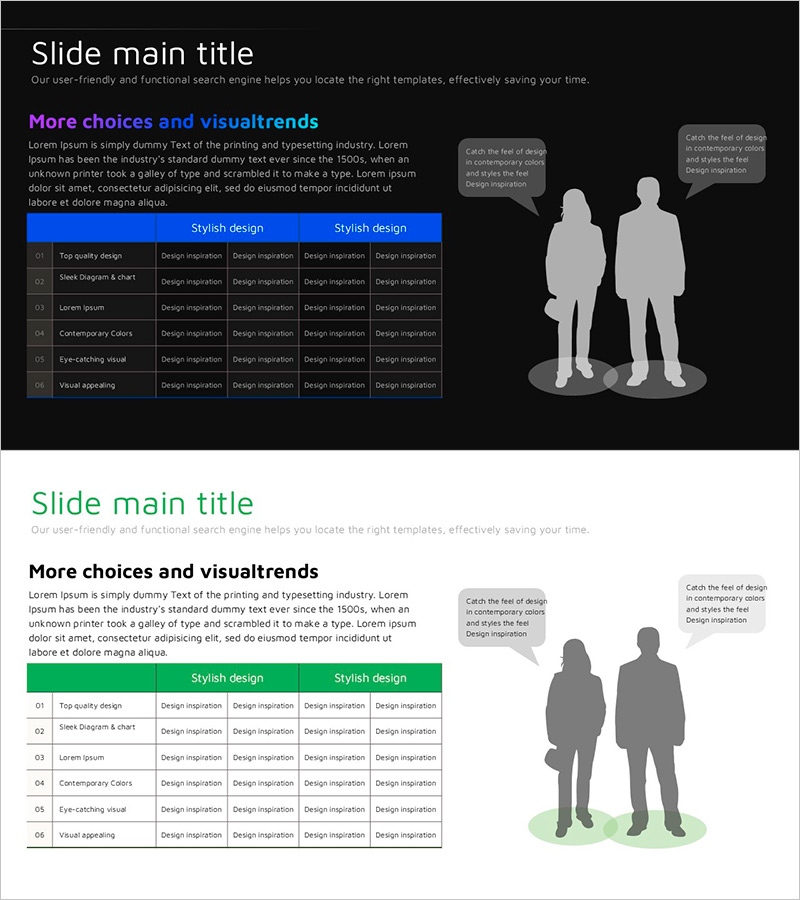
Infinite Energy Wide PPT Table and Silhouette
#Customer Success Stories #Diagram #Other
-

City Theme Market Share Graph – Business Data Visualization
#Product/Service #Market and Competitor Analysis #Graph
-

Slide Showcasing Advantages of Climbing Exercise
#Product/Service #Marketing Plan and Strategy #Other
