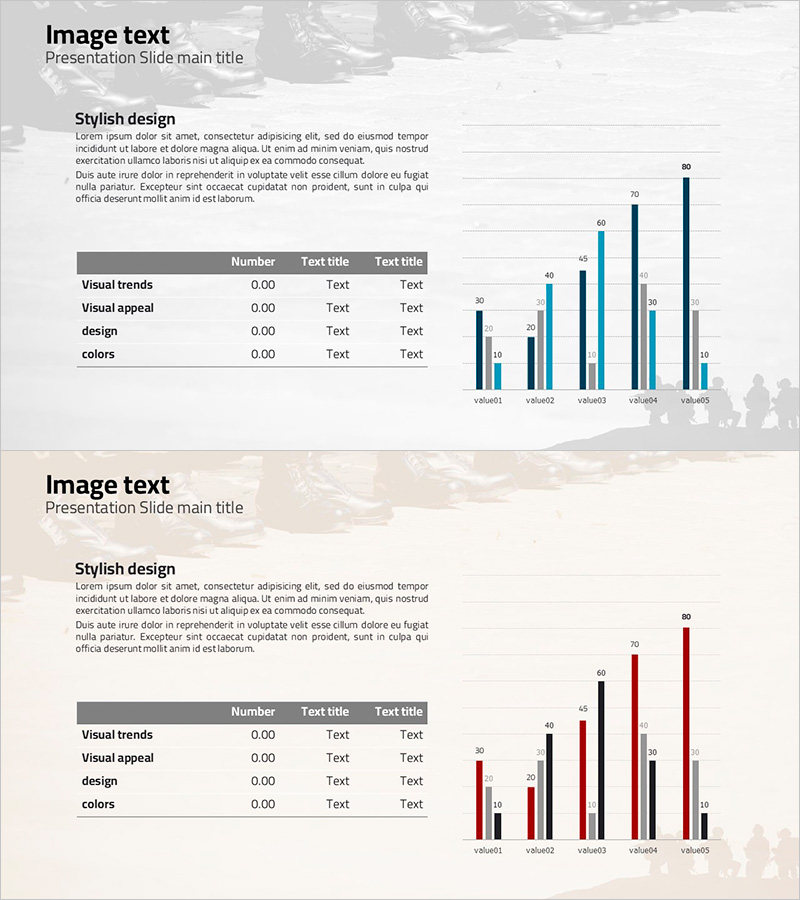
Market and Competitor Analysis
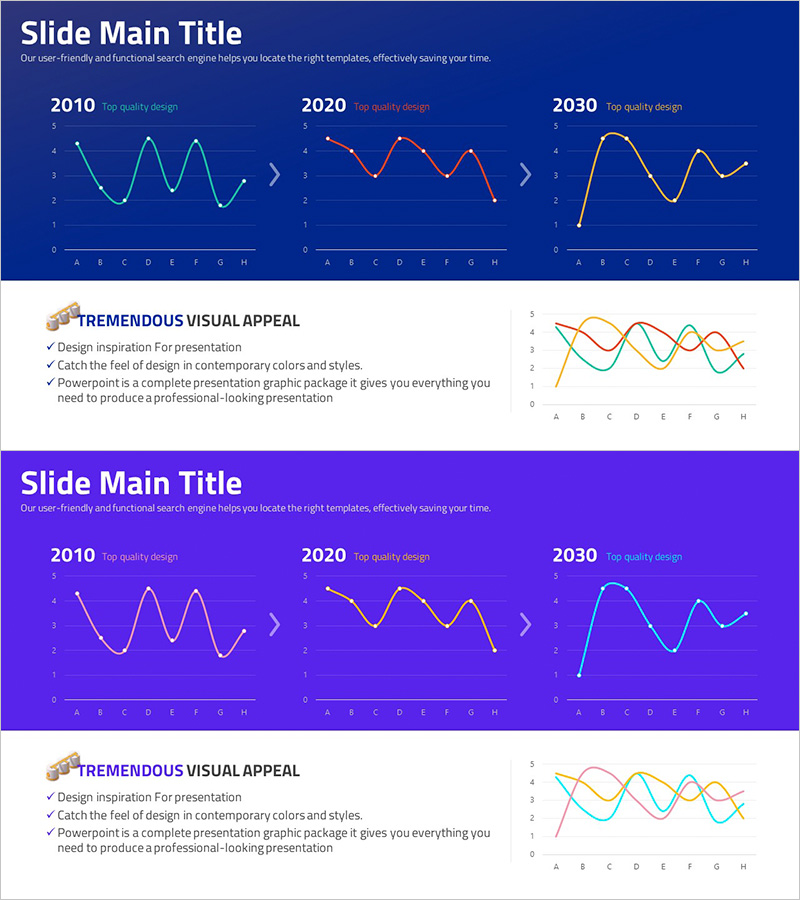
Graph Analysis of Growth – Data Visualization for Competitive Advantage
RJ0600056_12
- Last Update 12/21/2025
- File Size 2.2MB
- # of Slides 2
- File Format PPTX
- Slide Ratio 16:9
- Color
Keywords
About the Product
This slide effectively visualizes essential data for market analysis and competitor analysis using a growth graph. The modern and clean design, coupled with a combination of blue and red colors, enhances visual focus and facilitates easy data comparison. It is optimized for conveying critical information required to secure competitive advantage in business context. This slide will excel in internal reports, investment proposals, or executive presentations. Text and data sections can be easily replaced, and the overall editing difficulty is rated as 'moderate', enabling quick application in various presentations.
Related Products
-
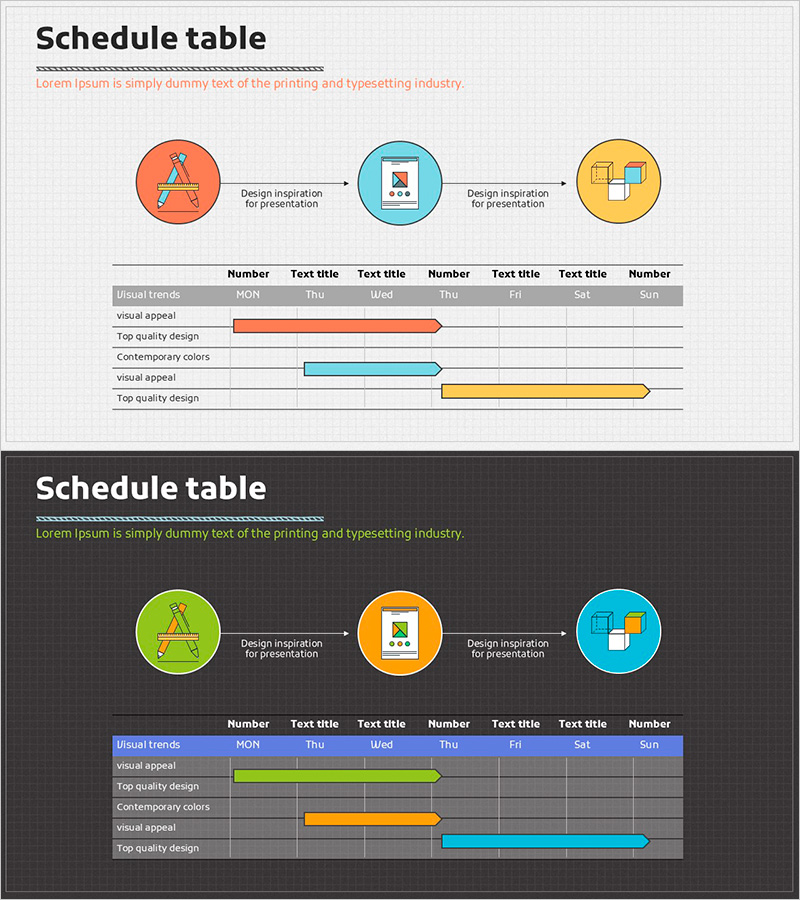
Learning Illustration Schedule – Linear Flow and Data Visualization
#Business Promotion Strategy #Operation Plan #Diagram
-
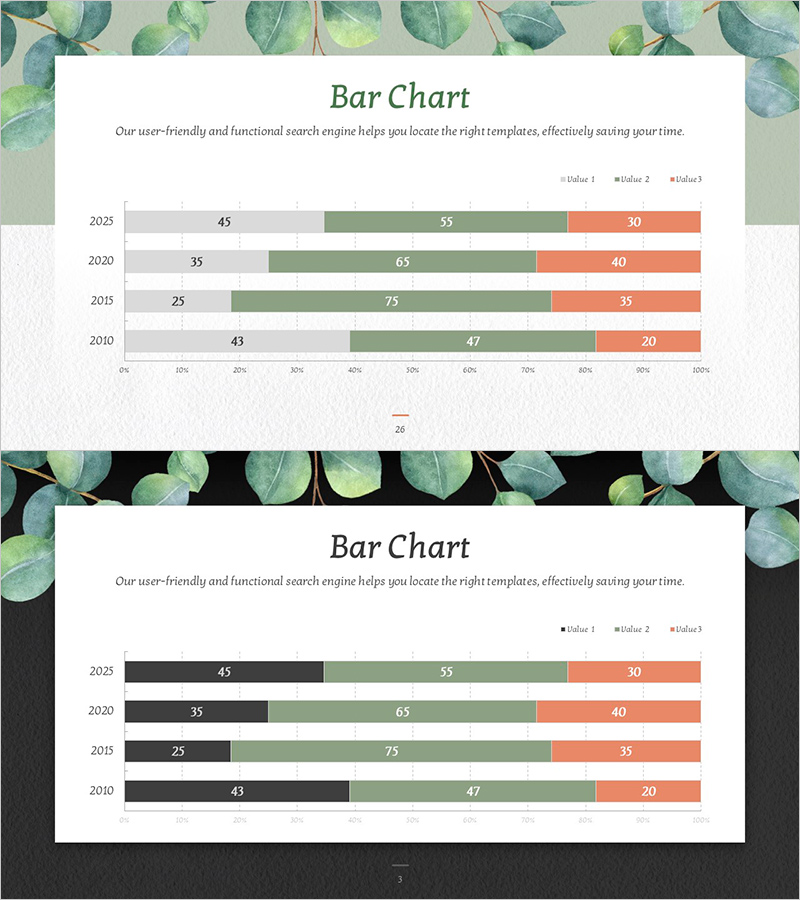
Horizontal Bar Chart Against Eucalyptus Background – Market Trend Analysis
#Market and Competitor Analysis #Graph #Industry Trends
-
Effective Water Resources Wide Presentation Template Diagram
#Product/Service #Operation Plan #Diagram
-
Data Visualization Showcasing Continuous Growth Trends – Business Insights
#Market and Competitor Analysis #Graph #Competitor Analysis
