Market and Competitor Analysis
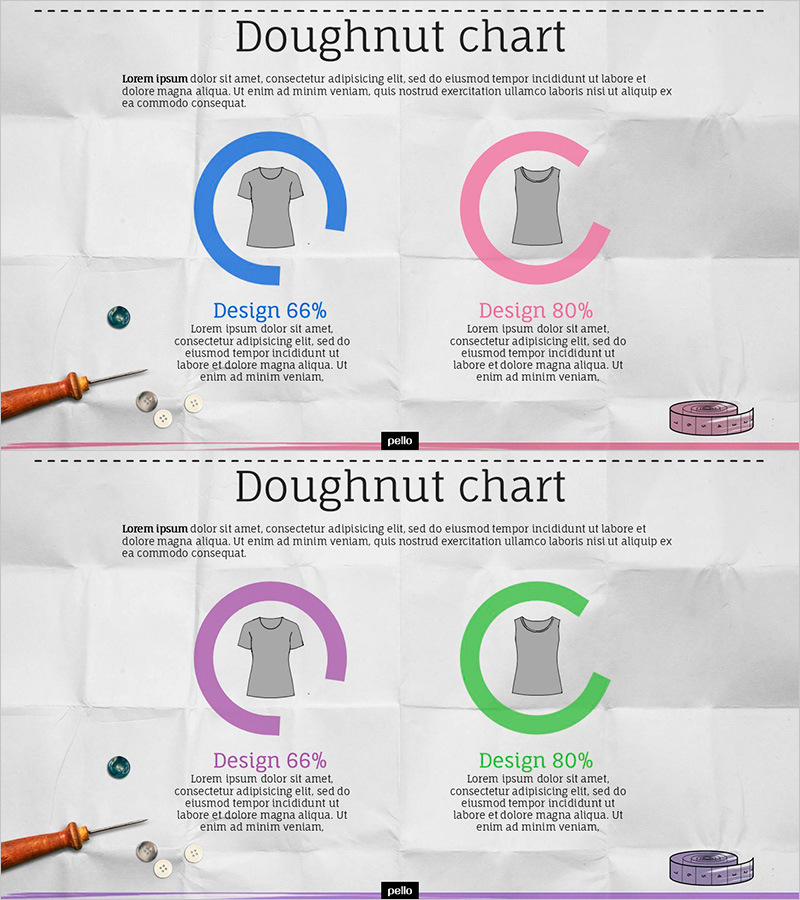
Fashion Design Comparative Donut Chart – Market Share Analysis
RJ0500019_9
- Last Update 12/21/2025
- File Size 1.7MB
- # of Slides 2
- File Format PPTX
- Slide Ratio 16:9
- Color
Keywords
About the Product
This slide utilizes a donut chart to visually represent the competitive aspects of fashion design in terms of market share. The harmonious use of blue, green, and purple colors aims for clear data communication, distinguishing a design share of 66% on the left and 80% on the right. Suitable for market and competitor analysis reports, it can effectively aid strategic decision-making for businesses. This slide features easily replaceable text and percentage information, with overall editing difficulty rated as 'easy'.
Related Products
-
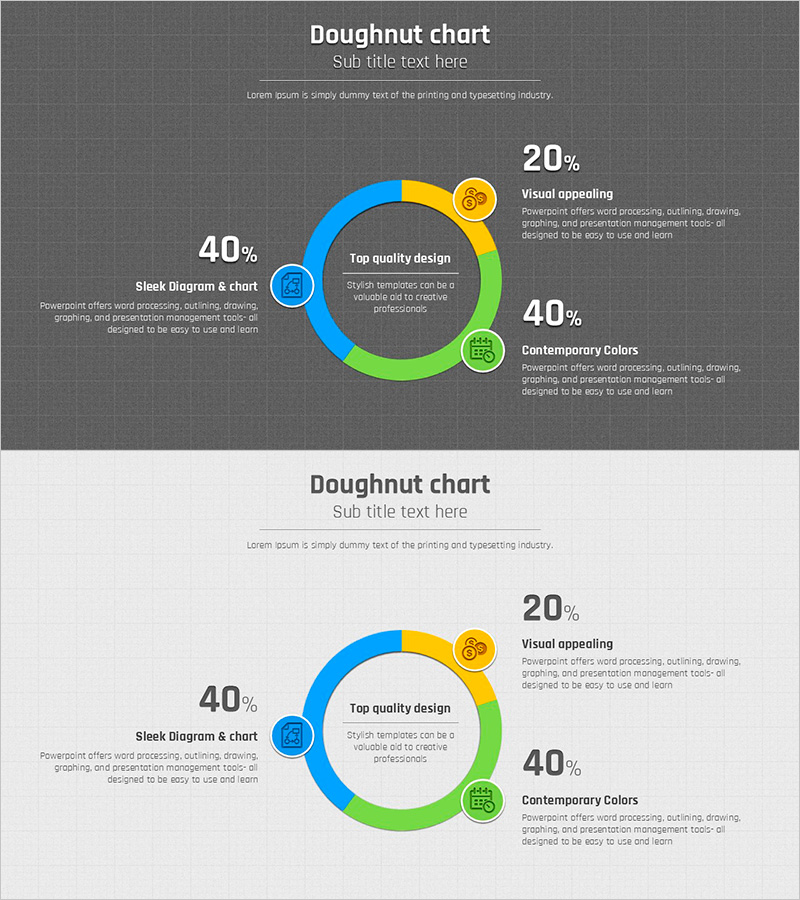
Business Strategy Presentation Template with Doughnut Chart
#Business Introduction #Business Promotion Strategy #Graph
-
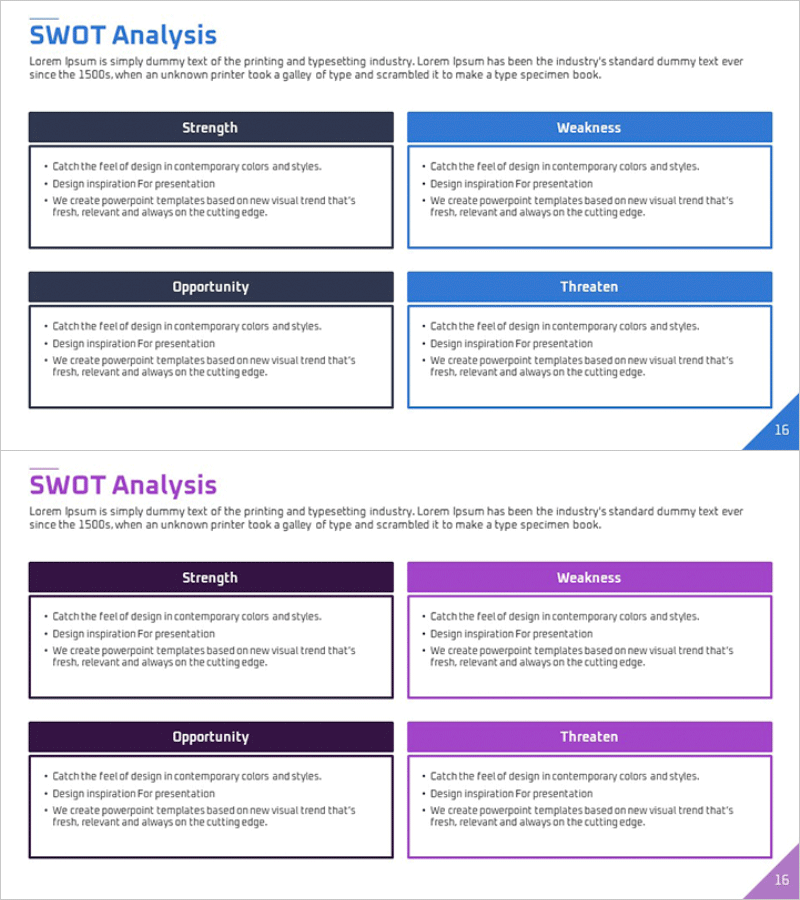
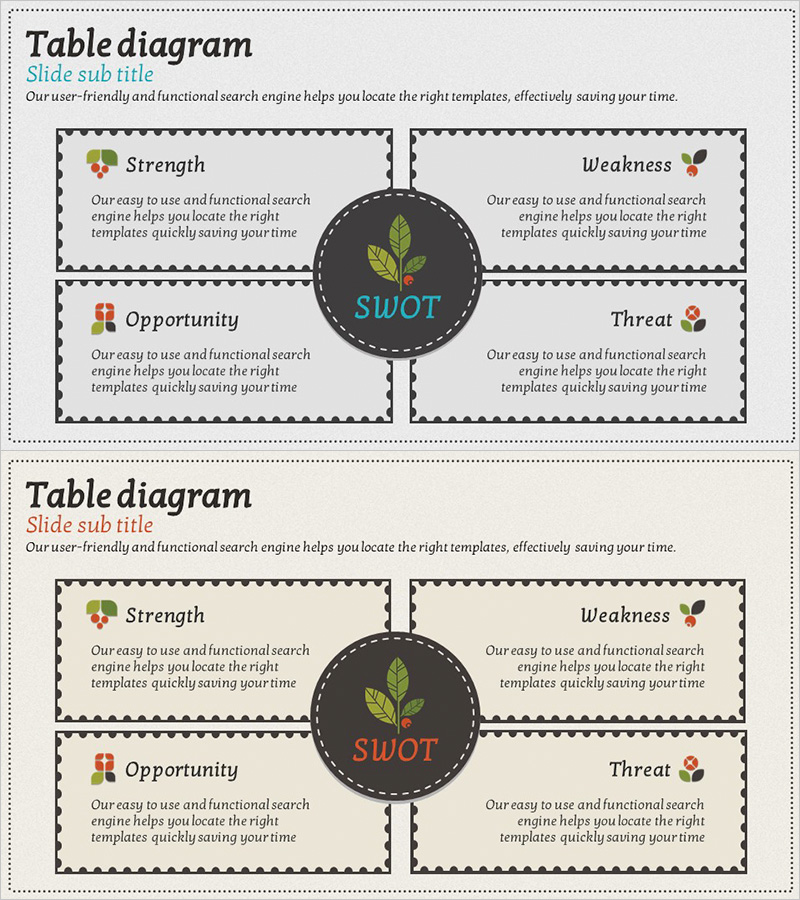
SWOT Analysis Closed Square Diagram
#Market and Competitor Analysis #Diagram #SWOT Analysis
-
SWOT Analysis of Our Services – Opportunities and Threats
#Market and Competitor Analysis #Diagram #SWOT Analysis
-
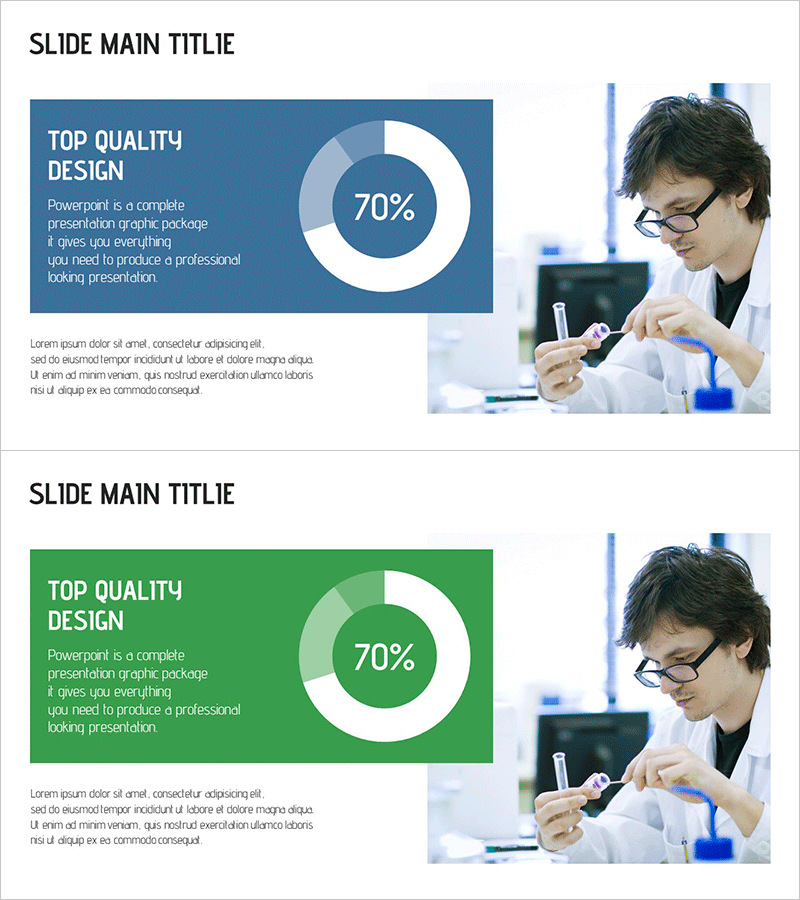
Infographic Slide Visualizing 70% Achievement – Top Quality Design
#Technology Sector #Graph #Research and Development
