Business Promotion Strategy
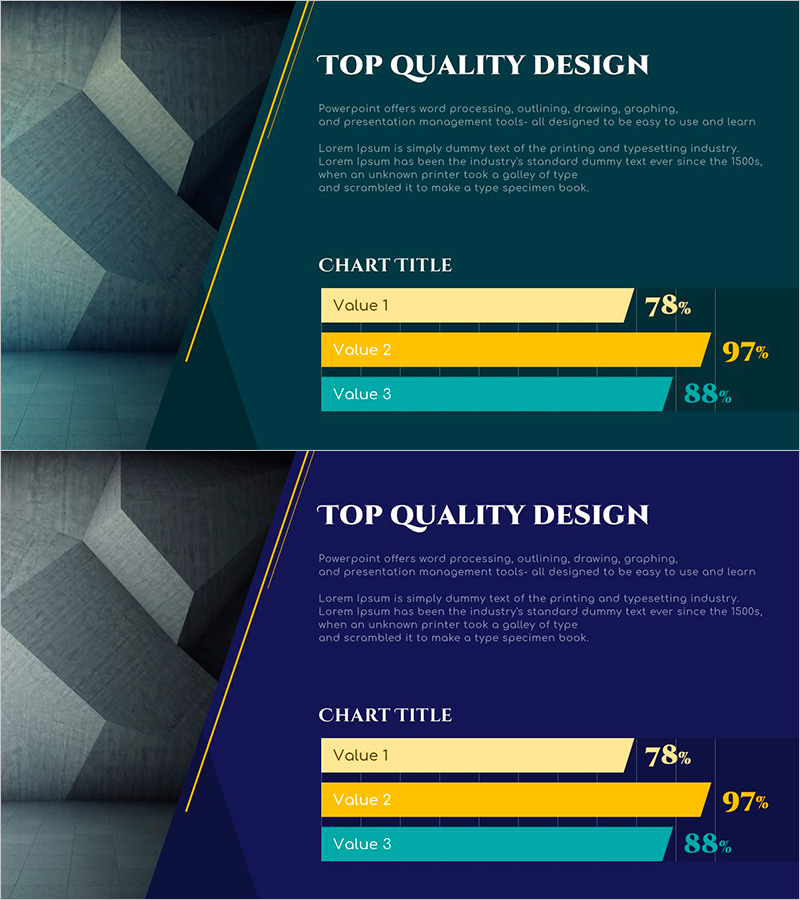
Slanted Horizontal Bar Graph – Visual Tool for Business Strategy
RJ0900034_8
- Last Update 12/21/2025
- File Size 1.7MB
- # of Slides 2
- File Format PPTX
- Slide Ratio 16:9
- Color
Keywords
About the Product
This slide features a slanted horizontal bar graph designed to visually communicate the performance of your business strategy. Using a sleek combination of teal, yellow, and purple, the slide enhances visual impact while clearly presenting data. It is particularly effective for highlighting competitive advantages or in reports related to market analysis. The text and colors are easily customizable, with editing difficulty rated as moderate, making it a versatile choice for various presentation needs.
Related Products
-
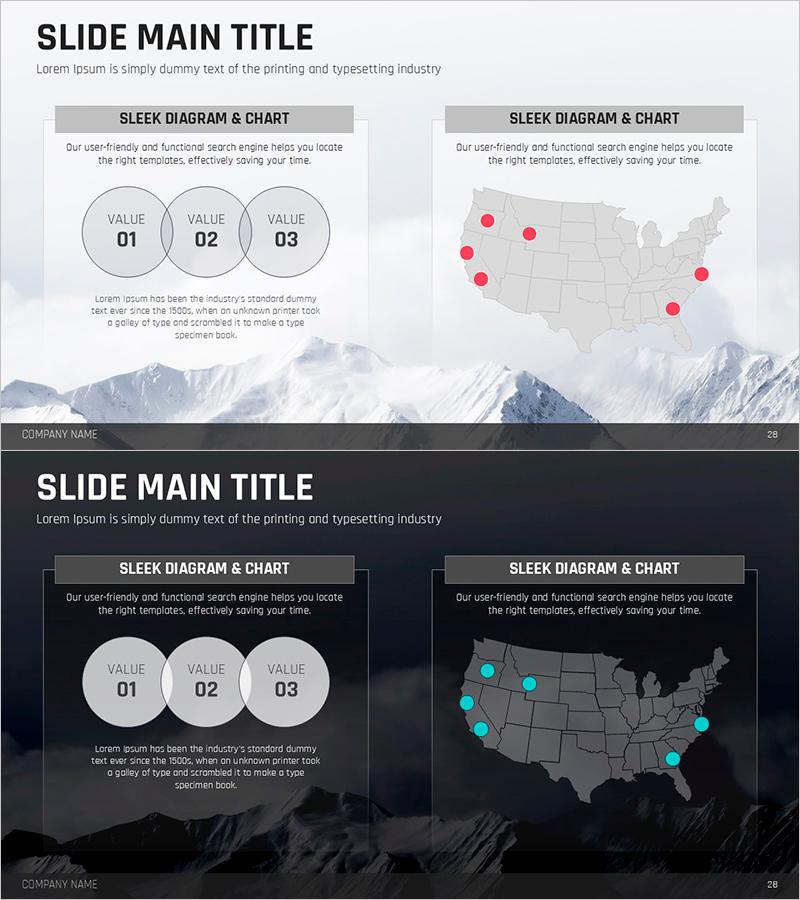
Overlapping Diagram and Target Market Location – Visualizing Marketing Strategy
#Marketing Plan and Strategy #Diagram #Other
-
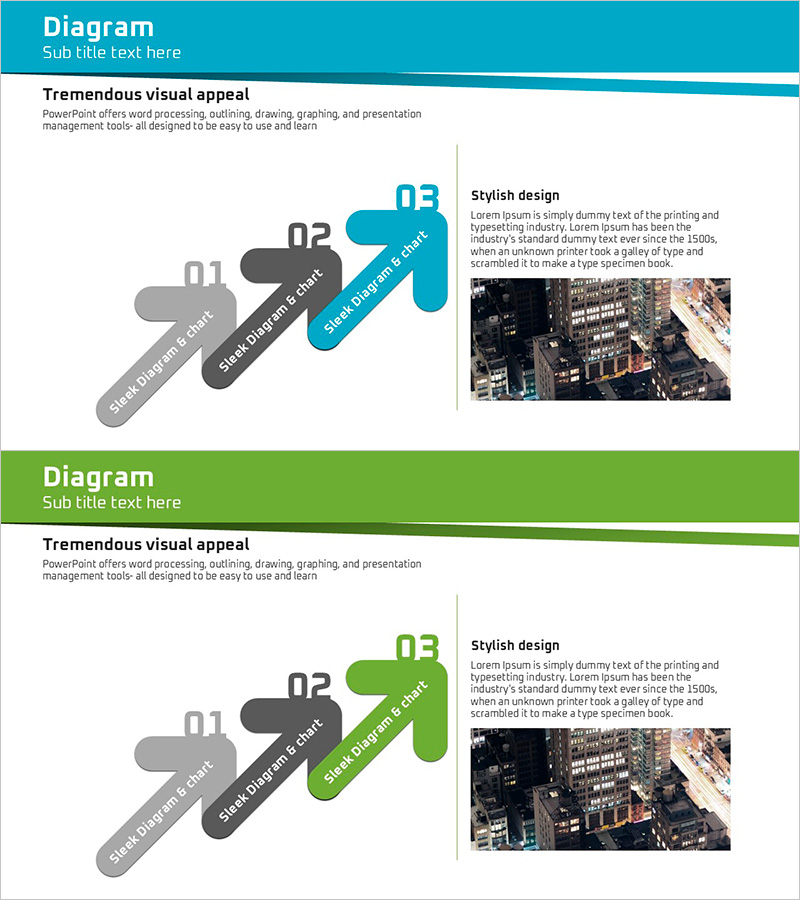
Business Forest Presentation Template – Step-by-Step Roadmap and Diagram
#Business Promotion Strategy #Diagram #Text Box
-
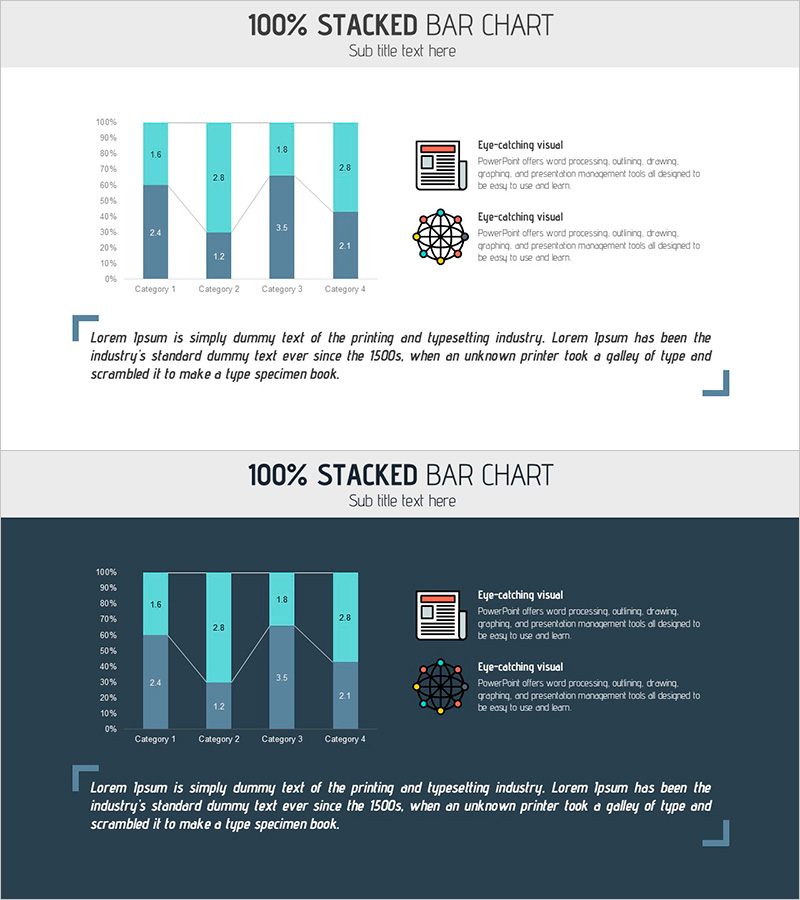
Technology Status Analysis Graph – Presenting Market Trends
#Market and Competitor Analysis #Financial Plans and Performance #Graph
-
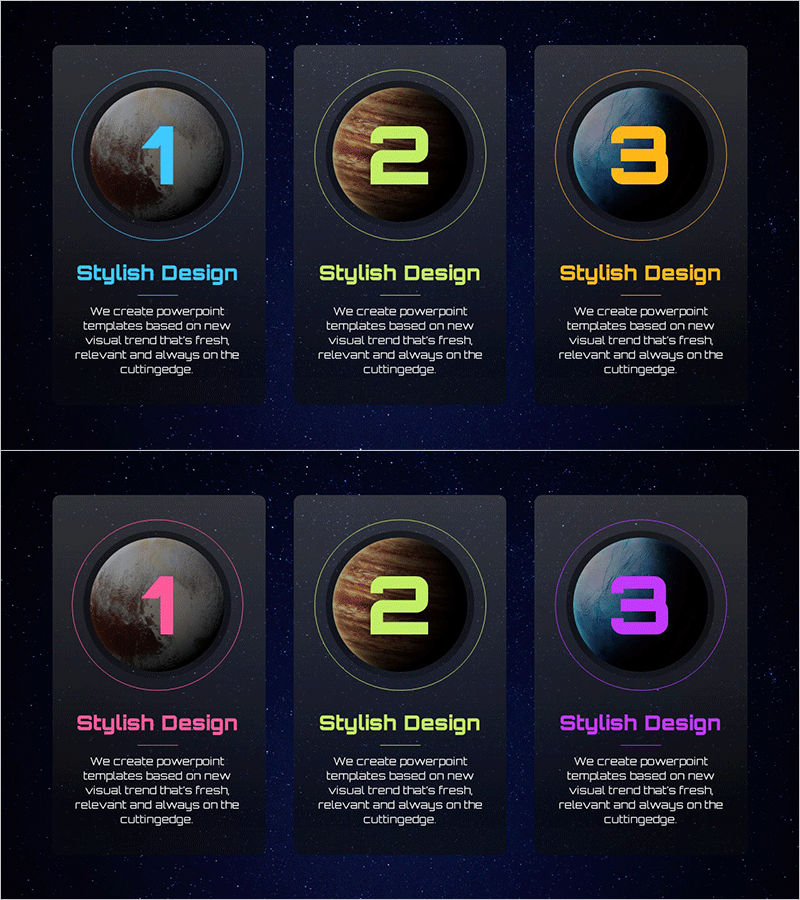
Stylish PowerPoint Template Based on Visual Trends
#Business Vision and Strategy #Business Promotion Strategy #Text Box
